
 Minority Exporters: Characteristics and Strategies for New Business and Expansion
U.S. Department of Commerce, Minority Business Development Agency
By: Sharon T. Freeman, Ph.D.
Published Fiscal Year 2015
This publication was developed by the Minority Business Development Agency (MBDA), a bureau within the U.S. Department of Commerce. Sharon T. Freeman, Ph.D. authored this report with contributions and guidance from MBDA and the U.S. Department of Interior’s Federal Consulting Group. We would like to acknowledge Adam Goldman, former MBDA Research Analyst, and Nicol Turner-Lee, Ph.D. Research Expert, for their thorough review and editing. We would also like to thank Kimberly R. Marcus, former Associate Director for Legislative, Education and Intergovernmental Affairs, for her stewardship; and Joann J. Hill, Chief of the Office for Business Development, for her input. MBDA acknowledges feedback and comments received from the staff at the Bureau of Economic Analysis, Nikolas Zolas and Sue Helper, and the U.S. Census Bureau’s, Katherine Russell and Anthony Caruso.
Foreward
Exporting is good for American business, American workers and the creation of American jobs - it stabilizes families and revitalizes communities. With 95 percent of the world’s consumers outside of the U.S., exporting as a strategy for growth in size and scale cannot be ignored. Minority business enterprises (MBEs) are uniquely qualified and equipped to enter global markets. They are: twice as likely to export; three times as likely to already have international operations and six times as likely to transact business in a language other than English. These operational factors strategically position MBEs to be successful exporters. As President Obama leads the nation from crisis to recovery, MBEs join all businesses in the restoration of American competitiveness in domestic and global markets.
This national effort is showcased in the National Export Initiative (NEI) which has successfully doubled U.S. exports in five years. For the fifth consecutive year, U.S. exports have set an all-time record, reaching $2.35 trillion in revenue in 2014. In that same year, U.S. export goods increased 2.7 percent to a record of $1.64 trillion in key industry sectors: capital goods; consumer goods; petroleum products; food and beverage; automotive vehicles and parts. Simply put: when America exports, America prospers. Under President Obama’s leadership, we have shifted our economy from a consumer focus, back to the production of goods and services, and created the conditions necessary for fair trade: advocacy, export financing, removal of export barriers, trade enforcement and international trade promotion. This ever leveling playing field has garnered us access to leading export markets in Canada, Mexico, and China. Through the NEI five-point strategy, the U.S. is returning to global leadership in foreign markets and MBEs are a part of that national economic restoration.
The vehicle for our global market engagement is a historic number of Free Trade Agreements (FTAs). The U.S. currently has 20 formal trade agreements that support record U.S. exports totaling, $765.1 billion - an increase of 4.3 percent from 2013. In 2014, U.S. exports accounted for 11.3 million jobs, adding 1.6 million export-supported, living-wage jobs to the economy since 2009. Based on the most recent available data from the U.S. Census Bureau, our report, Minority Exporters: Characteristics and Strategies for New Business and Expansion, shares the unique characteristics of exporters. The report also offers comparisons to both non-exporting counterparts and nonminority exporters to glean both the opportunities and challenges faced when MBEs conduct business globally.
The data in the report represents good news for MBE exporters: more than 28,000 MBEs exported goods and services valued at over $30 billion in 2007, representing 17.5 percent of all classifiable exporting businesses in the United States. For MBEs, significant engagement in international sales and trade, leads to stronger businesses, creates new jobs, and in the long-term, contributes to the sustainability of the commercial ecosystems necessary to create thriving communities.
The success of U.S. exporting programs continues under the leadership of U.S. Commerce Secretary Penny Pritzker through NEI NEXT, a new customer service-driven strategy with improved information resources that ensures American businesses can capitalize on expanded opportunities to sell their goods and services abroad. NEI/NEXT will help even more American companies reach more overseas markets by improving data, providing specific export opportunities, access to export financing, and partnering with states and communities to sustain local export efforts.
The Minority Business Development Agency (MBDA) is pleased to be a foundational partner in the President’s ongoing efforts to increase U.S. exports. Minority entrepreneurs have the cultural insight, linguistic skills and market intelligence to not only excel as U.S. exporters, but to also be strong strategic partners for those entering global markets for the first time. According to 2007 U.S. Census data, MBEs are three times as likely to generate 100 percent of their revenue from exports – making MBEs strong allies in U.S. export strategies.
As the nation returns to its position of economic strength and global market leadership, minority entrepreneurs join all American businesses in adding value to the nation’s bottom line - creating jobs, restoring communities and instilling hope. We trust that the information presented in this report is both informative and instructive, featuring case studies of actual MBE exporters. This report is a part of MBDA’s ongoing commitment to offer relevant information on minority enterprises and the valued contribution to our nation’s social and economic well-being.
Alejandra Y. Castillo
National Director
Minority Business Development Agency
Table of Contents
FOREWARD
LIST OF TABLES AND APPENDICES
WHY EXPORTING MATTERS AND HOW THE NATION PROMOTES EXPORTS
The Obama Administration and the National Export Initiative (NEI NEXT)
Region-Specific Special Trade Promotion Initiatives of the Obama Administration
UNIQUE CHARACTERISTICS AND CHALLENGES IN MBE EXPORTING
Entrepreneurial Orientation
Country of Origin Linkages
Racial and Ethnic Ties
Cultural Heritage
Barriers to Exporting
A PROFILE OF THE CHARACTERISTICS OF MBE EXPORTERS
MBE Export Global Markets
Top MBE Export Products
Other Key Characteristics of MBE Export Markets and Products
Employment by MBE Exporters vs. Non-Exporting MBEs
Productivity, Employment, and Export Receipts of MBE Exporters vs. Non-Exporting MBEs
Analysis of Country of Origin Social Network Effects of MBE Exporters
AVAILABLE RESOURCES FOR MBE EXPORTERS
Federal Government
Local and State Governments
Government-Supported Financial Agencies
Non-Governmental Facilitators
CASE STUDIES OF FOUR SUCCESSFUL MBE EXPORTERS
Case # 1: MBE Exporter Candace Chen: Exporting to China and to Multiple Countries
Case # 2: MBE Exporter Irismar Henrie: Exporting to Brazil and to Multiple Countries
Case # 3: MBE Exporter Luis German Guacaneme: Exporting to Colombia
Case # 4: MBE Don Williams: Exporting among African American Firms
Lessons Learned From the Case Studies
APPENDIX 1: RESEARCH AND METHODS TECHNICAL NOTES
ABOUT THE MINORITY BUSINESS DEVELOPMENT AGENCY (MBDA)
About the U.S. Department of Commerce
List of Tables and Appendices
Table 1. Major Export Categories, 2012
Table 2. Comparisons of MBE Exporter and Non-Exporter Performance for Hispanic-Owned Firms, 2007
Table 3. Top 10 Destinations in Value for MBE Exports, 2007
Table 4. Select Export Products and Export Receipts of Minority Exporting Firms, 2007
Table 5. Key Characteristics of All Exporting Firms with and without Employees by Race and Minority Status, 2007
Table 6. Exporting MBE Productivity vs. Productivity of Non-Exporting MBEs, 2007
Table 7. Employees of MBE Exporting Firms vs. Non-Exporting MBEs, 2007
Table 8. MBE Exporter Receipts vs. Nonminority Exporter Receipts, 2007
Table 9. Chinese MBE Exports to China vs. Asian Indian Exports to China, 2007
Table 10. Asian Indian MBE Exports to India vs. Chinese Exports to India, 2007
Table 11. Mexican and Mexican American MBE Exports to Mexico vs. Chinese Exports to Mexico, 2007
Table 12. Hispanic MBE Exports to Mexico vs. Asian Exports to Mexico, 2007
List of Tables: Appendix 1
Table A. Relative Standard Errors for MBEs with Exports vs. MBEs without Exports for Table 6
Table B. Relative Standard Errors for MBEs with Exports vs. Nonminority Firms with Exports for Table 6
Table C. Relative Standard Errors for MBEs with Exports vs. Nonminority Firms without Exports for Table 6
Table D. Relative Standard Errors for Asian Firms with Exports vs. Asian Firms without Exports for Table 6
Table E. Relative Standard Errors for Black or African American Firms with Exports vs. Black or African American Firms without Exports for Table 6
Table F. Relative Standard Errors for American Indian and Alaska Native Firms with Exports vs. American Indian and Alaska Native Firms without Exports for Table 6
Table G. Relative Standard Errors for Hispanic Firms with Exports vs. Hispanic Firms without Exports for Table 6
Table H. Relative Standard Errors for MBEs with Exports vs. Nonminority Firms with Exports for Table 7
Table I. Relative Standard Errors for Black or African American Firms with Exports vs. Black or African American Firms without Exports for Table 7
Table J. Relative Standard Errors for American Indian and Alaska Native Firms with Exports vs. American Indian and Alaska Native Firms without Exports for Table 7
Table K. Relative Standard Errors for Asian Firms with Exports vs. Asian Firms without Exports for Table 7
Table L. Relative Standard Errors Hispanic Firms with Exports vs. Hispanics Firms without Exports for Table 7
Table M. Relative Standard Errors for Export Share of Total Revenue: MBE Firms with Exports vs. Nonminority Firms with Exports for Table 8
Table N. Relative Standard Errors for Comparison of Export Share of Total Revenue Among MBE Firns with Exports: Hispanic vs. Asian Firms for Table 8
Table O. Relative Standard Errors for Comparison of Export Share of Total Revenue Among MBE Firms: Black or African Americans vs. Hispanic Firms for Table 8
Table P. Relative Standard Errors for Comparison of Export Share of Total Revenue Among MBE Firms: Black or African American vs. Asian Firms for Table 8
Table Q. Relative Standard Error for Comparison of Chinese MBE Firm Exports to China vs. Asian Indian Exports to China for Table 9
Table R. Relative Standard Errors for Asian Indian MBE Firm Exports to India vs. Chinese Firm Exports to India for Table 10
Table S. Relative Standard Errors for Hispanic MBE Firm Exports to Mexico vs. Asian MBE Firm Exports to Mexico for Table 11
Table T. Relative Standard Errors for Mexican, Mexican American, Chicano MBE Firm Exports to Mexico vs. Chinese MBE Firm Exports to Mexico for Table 12
Executive Summary
As of 2007, 28,531 minority business enterprises (MBEs) generated products and services valued at over $30 billion, representing 17.5 percent of all classifiable exporting businesses in the United States.2 This report, Minority Exporters: Characteristics and Strategies for New Business and Expansion, characterizes the nature of MBE exporters to understand the potential for the further growth of this group and whether lessons learned from this group can be applied to other small and medium-sized enterprises (SMEs). MBEs have a strong competitive advantage in international business transactions due to cultural affinities, multilingual skills, and close ties to countries of origin. Through a comprehensive literature review and the presentation of select case studies, this report surfaces many of the export characteristics of these firms, particularly the number of employees, levels of productivity, and share of receipts when compared to non-exporting MBEs.
The data presented in this report is based on the Ownership Characteristics of Classifiable U.S. Exporting Firms, 2007: Survey of Business Owners and A Profile of U.S. Importing and Exporting Companies, 2010-2011. The report concludes with four case studies of actual MBE exporters to the Obama Administration’s NEI NEXT target markets that summarize both best practices and challenges in exporting.3
According to the data, MBE exporters have more employees, higher productivity and their share of receipts from goods or services when compared to nonminority exporters. MBEs also have a comparative advantage relative to other nonminority-owned firms that allow them to conduct more business in the countries in which they have ties, as shown in the case of Asian- and Hispanic-owned firms. These cultural relationships have helped MBE exporters overcome numerous barriers to exporting, such as fixed costs that prevent most other firms from doing the same. Evidence from the case studies presented in this report supports this finding, and shows that, in the absence of such linkages, being entrepreneurially-oriented and engaging in proper export planning can also lead to viable business models.
Key Findings
U.S. Exports are greatly contributing to increased revenues and jobs overall.
- U.S. exports of goods and services increased in 2012 to a record $2.2 trillion generating 9.8 million jobs overall and 13-18 percent higher wages than the national average through export jobs.
- Over 300,000 identified U.S. exporters were responsible for creating these jobs and generating more than $1.3 trillion in exports.
MBEs benefitted from exporting when compared to nonminority-owned exporters in 2007.
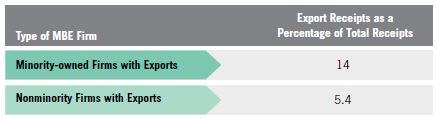
- Minority-owned firms accounted for a disproportionately smaller share of exporters relative to their numbers, but exports accounted for a larger percentage of their receipts when compared to non- MBE export firms.
- Exports accounted for 14.4 percent of total receipts ($212.3 billion) of minority-owned exporters compared to 5.4 percent of total receipts ($2.5 trillion) for nonminority-owned exporters.
MBEs experienced growth in size, employees, and productivity from exporting, especially when compared to comparable minority-owned non-exporting firms.
- MBEs exported goods and services to 163 countries that were valued at over $30 billion in 2007.
- Minority-owned exporting firms were larger than non-exporting minority-owned counterparts; average receipts for MBE exporting firms were $7.4 million as compared to $141,776 for minority-owned non-exporting firms.
- The average number of employees for MBE exporting firms was 21; the comparable number for MBE non-exporting was seven.
- Average productivity for MBE exporters (i.e., receipts per employee) was $407,592; the comparable number for minority-owned employer non-exporters was $122,545.
MBE exporters were in the same global markets as nonminority exporters representing diverse goods.
- The top ten export markets for MBEs were: China, Mexico, Japan, South Korea, Canada, Venezuela, Guatemala, Hong Kong, India, and Taiwan. These markets are the same for nonminority exporters.
- Plastic, iron and steel, nuclear reactors/boilers/ machinery, electric machinery and vehicles were among the top five products of MBE exporters.
Some MBE subgroups were higher exporters in 2007 when compared to others.
- The number of Asian American firms (16,451) was highest for MBE exporters, followed by Hispanic firms (9,868) and African American firms (1,566) in 2007.
- MBEs with greater country of origin linkages tend to export more to their home country. In this study, for example, Chinese-owned firms exported more to China than Asian-Indian-owned firms, and this trend was consistent for all minority subgroups with country ties, e.g., Asian-Indian-owned firms exported more to India and Mexican-owned firms exported more to Mexico.
Information from the four case studies also suggests that U.S. Free Trade Agreements (FTAs) have greatly facilitated the entry of MBEs into global markets. Having both private and public partners and a reliable network of agents, distributors and other partners in foreign markets, the highlighted cases of MBE exporters have been able to promote sales and subsequent services. One of the additional lessons gleaned from this study is that tapping into smaller niche markets can be a key to business effectiveness for MBEs entering foreign markets with large distributors.
Increased support of MBE exporters is still essential to their growth in this area, and analyzing data about their characteristics will be useful to understanding exporting benefits. As the U.S. population trends toward a majority- minority, the share of MBE business ownership should parallel this growth, with exporting as one of many viable options available to these firms. In the end, leveraging the ability of MBEs to export benefits the nation through job and wealth creation that ultimately contribute to U.S. global competitiveness in existing and emerging industries.
Introduction
The nonminority4 population in the U.S. is projected to plateau by 2043. Compared to the nonminority population, all minority subgroups are projected to increase in their share of the total U.S. population between 2015 and 2060.5 These demographic shifts follow similar trends in MBE growth. In the eight years since the 2007 export data was captured, MBEs gained a greater foothold in international markets, thus contributing to their export capacity.
In 2007, 28,531 minority business enterprises (MBEs) exported to at least one other country.6 These firms exported goods and services valued at over $30 billion, representing 17.5 percent of total exports in the United States.7 MBEs represent many different racial and ethnic subgroups and some possess unique qualities such as language skills, country of origin connections, racial bonds, cultural affinity, and market linkages that enhance their ability to create trading opportunities in selected markets, and overcome certain fixed cost impediments to exporting. Thus, they have a strong competitive advantage when entering international markets. Ensuring that MBEs are both aware and take advantage of U.S. trade policy, they can better position themselves to achieve the goals of the U.S. International Trade Administration’s National Export Initiative (NEI NEXT).8
This report, Minority Exporters: Characteristics and Strategies for New Business and Expansion, defines MBEs as businesses that are owned or controlled (greater than 50 percent) by the following persons or groups of persons who are also U.S. citizens or resident aliens admitted for lawful admission to the United States: African Americans, Hispanics, Asians, Native Hawaiians and Other Pacific Islanders, American Indians and Alaska Natives (including Alaska Native Corporations and tribal entities), and Hasidic Jews.
The Minority Business Development Agency (MBDA) commissioned this study to glean insights into the characteristics of MBE exporters, and assess whether their contributions to exporting could be even greater.
This report also provides resources for identifying export opportunities. Before concluding the report, four case studies of actual MBE exporters to NEI NEXT target markets are presented to summarize the best practices and challenges from their experiences. The report concludes with recommendations on how to increase the transactional potential of MBE exporters as compared to non-exporting MBEs.
The next section outlines the research methodology for the paper.
Data and Research Methods
Data for the report comes from the following U.S. Census Bureau publications: Ownership Characteristics of Classifiable U.S. Exporting Firms, 2007: Survey of Business Owners (SBO) (2007 SBO), and A Profile of U.S. Importing and Exporting Companies, 2010- 2011 (2010-2011 Profile). Additional data is gleaned from 2007 U.S. Census data that include: U.S. Census Bureau, Ownership Characteristics of Classifiable U.S. Exporting Firms: Survey of Business Owners, 2007 (2007 SBO), and A Profile of U.S. Exporting Companies, 2007-2008 to understand the characteristics of minority exporting firms. In analyzing U.S. Census data, confidence interval tests were applied to ensure that cited results are significant at the 90 percent level.9 The research methodology is further explained in Appendix 1.
Such testing was performed on the three main characteristics of MBE exporters examined in the U.S. Census datasets: size, employment, and productivity.10 Confidence interval testing was also conducted to ascertain the existence of a “country of origin social network effect” that demonstrates whether there is a propensity for certain subgroups to export more to the countries of their ethnic origin.11 As part of this study, a comprehensive literature review is included to expand upon the nature of MBE exporting subgroups.
The U.S. Census Bureau also made some new data available to MBDA for this report that includes the countries to which MBEs exported in 2007 through the SBO “snapshot.”12
Case studies from qualitative interviews performed over the course of the research are also included in the report. As mentioned, the four case studies focus on the unique characteristics of MBE exporters to emphasize both the opportunities and challenges faced by new and seasoned firms.
Why Exporting Matters and How the Nation Promotes Exports
In recent decades, global integration and the openness to trade have been catalysts for strong economic growth in many countries. U.S. exports of goods and services increased in 2012 to a record $2.2 trillion.13 As of 2012, exports also influenced the following job outlook:14
- 9.8 million jobs overall;
- 7.3 million jobs related to exports of goods;
- 2.5 million jobs related to service exports; and
- 13-18 percent higher wages than national average were paid by export jobs.
Over 300,000 identified U.S. exporters were responsible for creating these jobs and for generating over $1.3 trillion in exports.15 Among identified exporters, small and medium-sized businesses (with fewer than 500 employees) represented over 97 percent of the total, while large identified companies were responsible for 66.7 percent of the known export value, as reported by the U.S. Census Bureau. The major export categories among all companies in 2012 are shown in Table 1.
Table 1. Major Export Categories, 2012
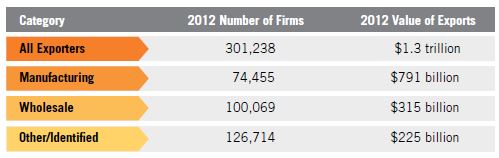
Source: U.S. Department of Commerce, U.S. Census Bureau, Profile of U.S. Importing and Exporting Companies, 2010- 2011.
The Obama Administration and the National Export Initiative (NEI NEXT)
In 2010, President Barack Obama announced the National Export Initiative (NEI) to double exports within five years and create two million jobs in America.16 In 2012, U.S. exports set a record, reaching $2.2 trillion in value. Growth in exports of goods and services outpaced the growth of imports of goods and services in terms of both dollars and percentages, with exports growing by $92.6 billion or 4.4 percent; and, exports as a share of U.S. GDP rose to 13.9 percent.17
NEI’s trade policy and promotions initiatives have created equity for U.S. companies selling their goods and services abroad. Key program approaches include:18
- Enhancing trade advocacy and export promotion efforts, including through initiatives such as the Doing Business in Africa19 campaign;
- Promoting the availability of export financing;
- Educating U.S. companies about markets opened by the U.S. Free Trade Agreements,20 including three that went into effect in 2012 in South Korea, Colombia and Panama;
- Negotiating and concluding new trade agreements– such as the Trans-Pacific Partnership (TPP) and the Transatlantic Trade and Investment Partnership (TTIP); and
- Enforcing U.S. trade rights under international agreements and investigating unfair trade practices affecting U.S. importers and exporters.
At the firm level, the 2010 NEI has strengthened trade promotion initiatives to help increase U.S. exports, particularly those of small and medium-sized businesses (SMEs). Such trade promotion initiatives entailed: increasing export assistance to SMEs; undertaking trade missions to promote exports by U.S. firms; increasing export credit; and strengthening export promotion services.
The initiative has since been expanded to the recently instituted NEI NEXT program, and this next iteration of the trade promotion program is poised to do even more. In particular, the expanded program is structured to help “U.S. manufacturers, farmers, workers, and innovators sell Made-in-America products and services world-wide to benefit the [national] economy.”21 Under the NEI NEXT program, there has been increased interagency advocacy support through the U.S. Department of Commerce’s Advocacy Center that has resulted in more than “200 wins for U.S. companies competing for foreign market government tenders, including nearly $160 billion in U.S. export content.”22 The initiative has also led to growth in the number of trade missions by 20 percent and double the number of companies participating, resulting in $9 billion in exports.
Within the Federal Government, the Office of the U.S. Trade Representative has principal responsibility for administering trade agreements that involve monitoring trading partners’ implementation of various business agreements, enforcing America’s rights under those agreements, and negotiating and signing trade agreements that advance the President’s trade policy. While the U.S. has agreements with many countries, the type of trade relationship that offers the highest level of benefit to the respective parties is the Free Trade Agreement (FTA).23 The positive results achieved through FTAs have encouraged the Obama Administration to engage in a number of region-specific trade promotion initiatives to promote the exports of U.S. companies that will be discussed in the next section.
Region-Specific Special Trade Promotion Initiatives of the Obama Administration
Trade policy and trade promotion go hand in hand. On the trade promotion side, examples of some of the ongoing strategic initiatives include:
Africa: According to President Obama, sub-Saharan Africa could be the world’s next major economic success story.24 In June 2012, the U.S. Strategy toward Sub-Saharan Africa was launched to promote economic growth, trade and investment in the region. A key component of the strategy is the Doing Business in Africa campaign that was launched by the U.S. Department of Commerce in Johannesburg, South Africa. The main objective is to bolster federal trade promotion and financing capabilities to help U.S. businesses obtain trade and investment opportunities. Since it’s unveiling, the U.S. Department of Commerce has been working alongside other federal agencies to encourage U.S. companies, especially SMEs and African diaspora-owned businesses, to trade with and invest in the region.
Latin America: Look South is an initiative aimed specifically at increasing U.S. trade with Latin American countries with which the U.S. has FTAs.25 It is part of the Commerce Department’s Open for Business Agenda that supports NEI NEXT by encouraging the expansion of export markets. MBEs are uniquely positioned to benefit from the Look South effort, which will help them expand to new export markets and generate more revenue.
Asia: The Trans Pacific Partnership (TPP) is the cornerstone of the Obama Administration’s economic policy in the Asia-Pacific.26 The large and growing markets of the Asia-Pacific are already key destinations for U.S. manufactured goods, agricultural products, and services suppliers. The TPP will expand trade and investment in the Asia-Pacific region.27 SMEs alone exported $247 billion to the Asia-Pacific in 2011.28
Europe: The Transatlantic Trade and Investment Partnership (TTIP)29 is a key initiative that is being negotiated between the European Union (EU) and the U.S. that aims to remove trade barriers in a wide range of economic sectors. By making it easier to buy and sell goods and services between the EU and the U.S. and cut tariffs across all sectors, the EU and the U.S. seek to tackle traditional barriers that limit exchange. TTIP negotiations also look at opening both markets for services, investment, and public procurement.
Overall, the NEI NEXT initiative has had a positive impact on U.S. exports. Understanding the growth potential of MBE exporters can also ensure that future initiatives are crafted to target these types of firms. The next section discusses some of the characteristics of MBE exporters and makes a case for paying greater attention to this subset of SME exporters in the future.
Unique Characteristics and Challenges in MBE Exporting
In composite, MBEs are comprised of a number of ethnic subgroups that are presumed to have ethnic and cultural characteristics that could be leveraged to create export opportunities. In this section, a comprehensive literature review provides insights into how some of these efforts may contribute to or stifle the ability of MBEs to export to key markets, especially those that are emerging, including Africa, Asia, and Latin America.
Among the unique characteristics of MBEs that are cited in the literature, four are often discussed: entrepreneurial orientation, country of origin linkages, racial and ethnic ties, and cultural ties.
Entrepreneurial Orientation
Entrepreneurial orientation refers to whether internal factors predispose individual firm owners to be less risk- averse when entering global markets. The notion of export readiness, in this context, has two dimensions: readiness in terms of technical capacity and “emotional” readiness.
Accordingly, increasing attention is being paid to analyzing the entrepreneurial orientation of immigrants and the foreign-born as their numbers continue to increase in the United States. Immigrants refer to individuals who are in various stages of the formal immigration process as defined and controlled by the U.S. Department of Homeland Security. While in the literature, the terms immigrants and foreign-born are used interchangeably, technically, the former only refers to those in a formal or completed immigration process. The foreign-born as a classification may or may not include immigrants (in U.S. legal immigration terms).30
In explaining how country of origin ties work, researchers Patel and D’Souza noted that immigrants and the foreign- born are assumed to be well situated with their knowledge of two societies, and that their strong ties to their countries lower the transaction costs for prospective exporters.31 Such transactions may have a pro-trade effect on exports between their host and origin countries and on the propensity of immigrants to export.
Regarding immigrant-owned businesses, the 2010 American Community Survey found that they employed 4.7 million and generated receipts of $776 million.32 The 2010 Current Population Survey, a joint effort of the Bureau of Labor Statistics and the U.S. Census Bureau, also recently studied business ownership patterns of immigrants.33 These data combined with the 2007 SBO provide a rich foundation for researchers, including the Migration Policy Institute, Brookings Institute, researchers commissioned by the U.S. Small Business Administration’s (SBA) Advocacy Office, and others to conduct research on the characteristics of immigrant business owners.
In 2012, the SBA Advocacy Office completed a landmark study, Immigrant Entrepreneurs and Small Business Owners, and their Access to Capital that concluded that business ownership rates are higher for immigrants than non- immigrants, with 10.5 percent of the immigrant work force owning a business compared with 9.3 percent of the non-immigrant work force.34 The study also found that business formation rates are also higher among immigrants than non-immigrants at 0.62 percent per month (or 620 out of 100,000) compared to the non-immigrant rate of 0.28 percent (or 280 of 100,000). According to the study, immigrants are more likely to export their goods and services than are non-immigrant owned businesses; 7.1 percent export compared to only 4.4 percent of non- immigrant firms. Along these lines, immigrant-owned businesses are also more likely to have higher shares of exports.35
The Fiscal Policy Institute’s Immigrant Research Initiative found in 2012 that immigrants from some countries— including some with relatively small numbers in the overall population—were disproportionately likely to be business owners.36 Their data also found that immigrants from the Middle East, Asia, and Southern Europe were particularly inclined toward business ownership. Immigrants from Greece, for example, were a tiny fraction of all immigrants are in the labor force, but 16 percent of Greek immigrants in the labor force were business owners—the highest share of any group. Immigrants born in Israel/Palestine37 were the group with the second highest rate of business ownership, followed by Syria, Iran, Lebanon, Jordan, Italy, Korea, South Africa, Ireland, Iraq, Pakistan, and Turkey.38
What these studies suggest is that immigrant and foreign- born, minority subgroups are dynamic, entrepreneurially oriented, and represent a growing share of the U.S. and business populations. These factors, among others, potentially position them to play an even greater role in contributing to MBE exports. However, non-immigrant- owned MBEs may also possess the same entrepreneurial traits. This is explored later in the case studies.
Country of Origin Linkages
Country of origin has influenced some MBEs to export, given the nature of their relationships with their home countries. Immigrant networks are believed to be important intermediaries that can mitigate informal barriers in home- country markets by providing information about demand, languages, business practices and laws, as well as instilling confidence to facilitate international trade. By reducing the cost of searching across national borders and serving as a means of enforcing contracts, immigrant owners increase the likelihood of a match between a buyer and a seller that often results in a completed transaction. Immigrant networks are also thought to lower the transaction costs of international trade by providing information about trade possibilities and aiding the enforcement of contracts that is a theme explored in the report’s case studies.
In her research study, author Behncke found that access to information can be quite significant when a firm enters a new market. Immigrants, for example, are more familiar with the legal system and culture of their home country and speak the local language.39 They also have better knowledge of the preferences of their home countries and can thus better identify market opportunities.40
Ethnic networks can influence trade through a transplanted home-bias effect or preference/demand channel affecting both supply and demand. Importantly, immigrants and the foreign born may introduce natives from the host country to their home country products that increase export opportunities for suppliers.41
Racial and Ethnic Ties
Although certain groups, such as African Americans, may not possess direct country of origin linkages, they may nevertheless have the racial and ethnic ties to other Black populations overseas, such as in Brazil, Colombia, and the Caribbean, that may be useful in forming trade relationships. Cultural affinities by way of historical origins make it easier to connect to emerging markets within the diaspora even without such direct ties. Many overseas Black populations have been typically marginalized, especially in commerce. Recent efforts have been made by foreign governments to enfranchise these groups in various ways, including through preferential access to government procurements. The question still remains, however, if African American-owned firms can leverage racial status to facilitate exporting.42
New racial inclusion initiatives in countries such as Australia, South Africa, Brazil, and Colombia present opportunities to explore the phenomenon further. When these initiatives include preferential access to government procurements, it might be advantageous for MBEs to consider jointly bidding on the opportunity with other firms to strengthen their bids.
The case of the South African Black Economic Empowerment, or formally the Broad Based Black Economic Empowerment Act of the South African Government, is one that is thought to provide such an incentive.43 Colombia’s Action Plan on Racial and Ethnic Equality, an initiative of the Colombian Government in partnership with the U.S., is another example of an inclusion program that may ultimately create business opportunities between the Afro-Colombia and African American business communities.44 It is still not clear whether this type of initiative or others have led to partnering between global Black-owned firms and U.S. African American-owned firms.
The U.S.-Brazil Joint Action Plan to Eliminate Racial and Ethnic Discrimination and Promote Equality is another high-level bilateral initiative led by the U.S. Department of State that seeks to foster greater involvement of the Afro- Brazilian community in the vast economic opportunities that exist throughout the country and in relation to the 2016 Olympics. This type of opportunity might lend itself to inter-firm collaborations.45
Later in the report, the case study of African American, MBE exporter Don Williams is shared to demonstrate how businesses without strong country of origins linkages can, in fact, leverage their understanding of international markets, and use of external exporting resources to build effective and sustainable business models.
Cultural Heritage
Understanding how cultural assets are leveraged can also potentially increase MBE exporting. Cultural assets can be material, immaterial, emotional and even spiritual.
In the case of Native Americans, for example, the 2012 Census reported that 1.2 percent of the U.S. population was Native Indian or Alaska Native.46 To foster the overall economic development of Native peoples, an Office of Native American Business Development (ONABD) was established within the U.S. Department of Commerce, and housed at MBDA to provide direct services to these groups. In so doing, recognition was given to the unique potential of leveraging Native American cultural assets to create exports with the following examples:
Tourism to Native American Communities: When foreigners visit and spend money in the U.S., the money they spend is considered an export. In 2012, foreigners spent a record $168 billion while traveling domestically. Among the over 66 million visitors to the U.S. in 2012, over 1.4 million visited Native American communities. These tourists were primarily from China, the U.K., Germany, France, South Korea, and Australia. The number of visitors from these countries is steadily increasing. The states where the foreign visitors are visiting Native communities include: California (45%); Nevada (38%); New York (32%); Arizona (19%); Florida (13%); Utah (11%); and Hawaii (10%). In these cases, Native American communities have formed a basis for linkages with these countries of visitor origins.
Specialty and Branded Products: In addition to attracting foreign visitors, Native American communities also produce specialty craft products that are in high demand by visitors and international buyers.
The foregoing examples demonstrate how cultural heritage can be leveraged as an asset to enhance export potential, and suggest that Native Americans, in particular, have distinct qualities to enhance trade engagement.
Barriers to Exporting
Despite the prospect for business development, why aren’t more firms exporting? The simple answer to the question is that the fixed and search costs associated with exporting are high.47 This is perhaps why, in part, the overall number of U.S. exporters is small relative to the total number of U.S. based businesses.
As is similarly the case for the overall universe of U.S. businesses, the share of MBE firms that exports is low, as reported in the 2007 SBO:
- Minority-owned firms accounted for a disproportionately small share of exporters relative to their numbers, but exports accounted for a larger
percentage of the receipts of minority-owned exporters than for nonminority-owned exporters. - In 2007, minority-owned firms (5.8 million) made up 21.9 percent of all classifiable firms (26.3 million), but the 28,531 minority-owned exporters accounted for only 17.5 percent of classifiable exporting firms (163,419).
- In 2007, exports accounted for 14.4 percent of total receipts ($212.3 billion) of minority-owned exporters compared with 5.4 percent of total receipts ($2.5 trillion) for nonminority-owned exporters.
The low participation rate of MBEs in exporting may be attributable, in part, to their inability to overcome some of the impediments to exporting that may fall disproportionately on them as smaller businesses.
Impediments to exporting that obstruct a firm’s capacity to launch, carry out, expand, or sustain activities in international markets can be categorized in two groups: internal impediments, resources and capabilities within the control of the firm and external impediments that include environmental factors outside the control of a firm.
Authors Patel and D’Souza categorize exporting impediments into two groups: functional and marketing in their research.48 The former includes both limits on reconfiguring an SME’s internal processes to meet the demands of export markets and impediments related to human capital, and resources and capabilities that restrict the formulation and implementation of strategies necessary for export success. Marketing impediments, by contrast, affect a SME’s capacity to price, distribute, and promote a product or service in a foreign market, and are additional barriers to exporting.
Insights into how such factors impede entry and expansion into the global marketplace can be found in the following study, The Impact of Credit Availability on Small Business Exporters.49 The report’s key findings underscore the impact of the following barriers on exporting: credit and financing, trade barriers, and lack of knowledge.
For MBEs, lack of credit and finance barriers impact exporters in two significant ways. First, exporters rely on credit to finance their working capital to a greater extent than do firms producing solely for their domestic market, in large part, because of the longer transportation time associated with exported goods. Cross-border transactions are also deemed to be more risky, so that payment guarantees provided by banks and other financial intermediaries play an important role in assuring both delivery of purchased goods to the importer, and payment to the exporter. The inability to access financing, therefore, suggests a greater adverse impact on exporting firms than on firms producing goods for domestic consumption. Small businesses also typically rely on bank credit more than large firms.50
An estimated 80 percent to 90 percent of world trade relies on finance (e.g., trade credit and insurance/guarantees) – mostly of a short-term nature. International supply chain arrangements have globalized trade finance along with production. Sophisticated supply chain financing operations have also become crucial to trade. Despite the importance of export financing, small firms, and particularly MBEs, have difficulty accessing it despite access to working capital programs associated with the Export- Import Bank51 and the SBA.52 Multiple other reasons complicate MBE financing, including a lack of knowledge about the existence of these mechanisms, and the absence of willingness and capacity of these firms to meet the lending standards. This issue is examined further in the case studies presented later in the report.
The U.S. International Trade Commission’s seminal study, Small and Medium-Sized Enterprises: Characteristics and Performance provides evidence that both tariffs and nontariff measures (NTMs) are relatively more burdensome to SMEs than to larger firms.53 In addition to NTMs, other business impediments such as transportation costs are also constraining. Trade barriers that include licensing, residency requirements, and commercial presence requirements, present especially burdensome challenges for services providers that export.54 Some of these barriers are internal to the firm, while others are associated with a lack of entrepreneurial orientation and potentially due to a lack of technical capacity.
Limited firm resources and international contacts, as well as lack of requisite managerial knowledge about internationalization, are critical financing constraints to exporters. Research that explores SME exporting constraints has also found that such lack of knowledge is considered to be one of a host of internal impediments that are idiosyncratic to a firm. Additional internal impediments might include a lack of organizational resources and competent personnel, an inability to meet quality standards, a lack of financial backing, insufficient information about a foreign market, an inability to meet design specifications, and an unfavorable image of foreign markets.
As discussed in Family Firms Venturing into International Markets, competing across national borders is more complex and resource-consuming than operating in the home market.55 Activities such as researching foreign markets, making products and service suitable for international customers, finding and contracting international buyers, moving goods and services across large distances, and making sure that products are managed properly on the way to their users, pose significant challenges to firms, and especially to small firms. Furthermore, firms transitioning to international markets face the liability of perceived “foreignness,” stemming from exchange risks of operating businesses in foreign countries, local authorities’ discrimination against foreign firms, and unfamiliarity with local business conditions that diminishes only as they gain more knowledge. Some MBE exporters, however, have found ways to overcome these barriers and some of the characteristics instrumental to this progression are described in the next section.
All of these characteristics serve to help or hinder the establishment or expansion of MBE exporting. And, the experiences by MBEs considerably vary by certain characteristics that are explained in the next section.
A Profile of the Characteristics of MBE Exporters56
In 2007, minority-owned firms exported over $30 billion in goods and services to 163 countries.57 Data on three key characteristics of MBE exporters reported by the 2007 SBO include:
Size: Minority-owned exporting firms were larger than their non-exporting minority-owned counterparts in terms of receipt size and employment. Average receipts for minority-owned exporting firms were $7.4 million; while for minority-owned non-exporting firms, $141,776.
Employees: The average number of employees for minority-owned exporting employer firms was 21; the comparable number for minority-owned non-exporting employer firms was seven.
Productivity: Average productivity for minority-owned employer exporters (i.e., receipts per employee) was $407,592; the comparable calculation for minority-owned employer non-exporters was $122,545. Among the subgroups within MBEs (Asian- and Hispanic- owned firms), U.S. Census data also found the following for Hispanic-owned exporting firms along the same variables:
Size: Average receipts for Hispanic-owned exporting firms were $7.24 million compared with $124,418 for Hispanic- owned non-exporting firms.
Employees: The average number of employees for Hispanic-owned exporting employer firms was 19; the comparable number for Hispanic-owned non-exporting employer firms was seven.
Productivity: Average productivity for Hispanic-owned employer exporters (i.e., receipts per employee) was $443,632; the comparable calculation for Hispanic-owned employer non-exporters was $119,869.
Table 2 illustrates the comparison of the foregoing characteristics data for exporting and non-exporting minority and Hispanic firms:
Table 2. Comparisons of MBE Exporter and NonExporter Performance for Hispanic-Owned Firms, 2007
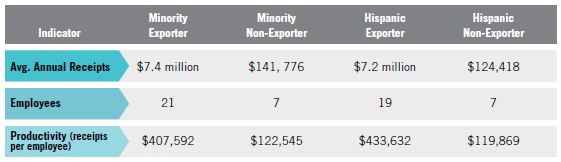
Source: U.S. Census Bureau’s Ownership Characteristics of Classifiable U.S. Exporting Firms: 2007 Survey of Business Owners (SBO) Special Report.
MBE Export Global Markets
While historical data about the countries to which MBEs export is not available, the 2007 SBO captured data on the countries to which MBEs exported. Based on this data, the top 10 markets for MBE exports in 2007 are shown in Table 3.
Table 3. Top 10 Destinations in Value for MBE Exports, 2007
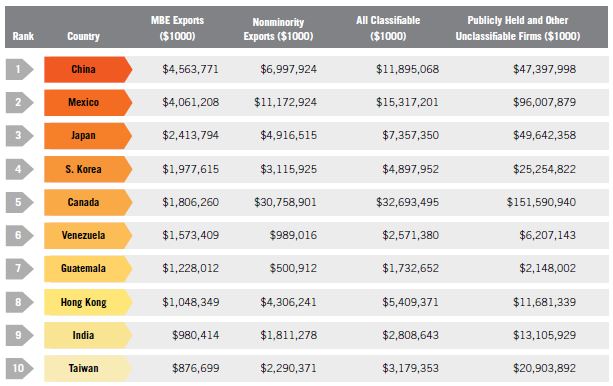
Source: U.S. Census Bureau, Special Tabulation of 2007 SBO Data for MBDA, January 2014. Note: Non-MBE exporters are not included in data analysis.
As shown in Table 3, many of the top markets for minority exports are the same as for nonminority exporters. However, the relative priority of certain markets for MBEs may be different due to the positively disruptive factor of country of origin linkages they possess that influence their demand and supply.
Top MBE Export Products
Table 4 provides a single year snapshot for some of the selected key export products of MBEs in 2007. Data are not available to indicate the countries to which MBEs exported their products.
Table 4. Select Export Products and Receipts for MBEs Compared to All Firms, 2007
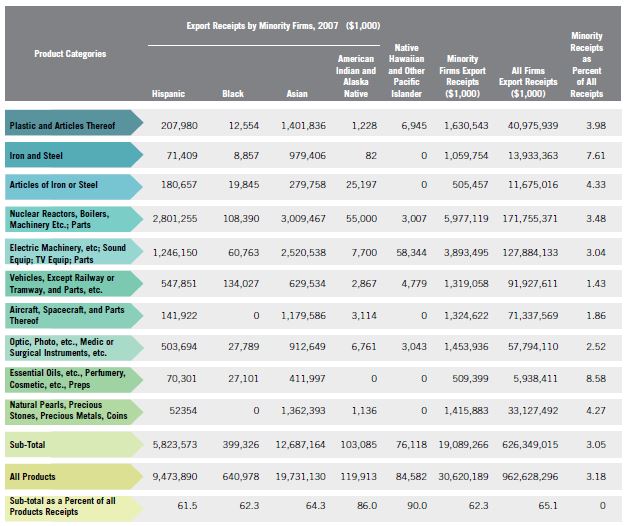
Source: Extracted from Special Census tabulation for MBDA of 2007 SBO Exports by Product.
Other Key Characteristics of MBE Export Markets and Products
The 2007 SBO found that exports comprise a larger share of receipts for MBE exporting as compared to non-exporting MBEs. Table 5 details the breakdown by minority subgroup.
Table 5. Key Characteristics of All Exporting Firms with and without Employees by Race and Minority Status, 2007
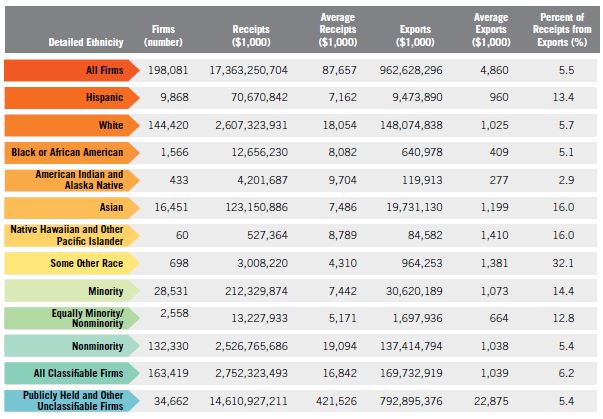
Source: Compiled from U.S. Census Bureau, 2007 Survey of Business Owners and 2007-2008: Profile of U.S. Exporting Companies.
Productivity, Employment, and Export Receipts of MBE Exporters vs. Non- Exporting MBEs
Results of confidence interval testing indicate a significant difference between exporting MBEs and non-exporting MBEs in terms of productivity, with the average productivity of exporting MBEs being almost three times that of non-exporting MBEs, as shown in Table 6.58
Table 6. Exporting MBE Productivity vs. Productivity of Non-Exporting MBEs, 2007
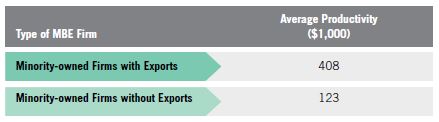
Source: U.S. Census Bureau, 2007 Survey of Business Owners; statistical analysis by author. *Note: Relative Standard Errors (RSEs) are included in Appendix 1.
The difference in the number of employees between exporting and non-exporting firms is also significant (See Table 7). Generally, MBE exporting firms tend to have almost triple the amount of employees than non-exporting MBE firms. Asian-owned export firms were found to have on average three times the number of employees than non-exporting Asian-owned firms. Hispanic-owned exporting firms had 19 employees on average compared to seven for non-exporting Hispanic-owned firms. Incredibly, African American-owned exporting firms have over four times as many employees on average than non-exporting African American firms. Appendix 1 includes data on employment by minority subgroups.
Table 7. Employees of MBE Exporters vs. Non-Exporting MBEs, 2007
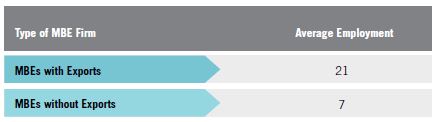
Source: Data U.S. Census Bureau, 2007 Survey of Business Owners; statistical analysis by author. *Note: Relative Standard Errors (RSEs) are included in Appendix 1.
The receipts from exports for MBEs were almost three times the amount that they were for nonminority exporters as shown in Table 8. A breakdown by minority subgroups is in Appendix 1.
Table 8. MBE Exporter Receipts vs. Nonminority Exporter Receipts, 2007
Source: U.S. Census Bureau, 2007 Survey of Business Owners; statistical analysis by author. *Note: RSEs are included in Appendix 1.
Based on the foregoing, it can be reliably stated that, at the firm level, MBEs have more positive outcomes in terms of the three main export-characteristics: size, productivity, and receipts.
Analysis of Country of Origin Social Network Effects of MBE Exporters
The data reveal that MBEs with ethnic ties to a country also export more to that geographic location. In this report, the “country of origin social network effect” was tested in the select case of Indians, Chinese, Koreans, and Mexicans. The results of the confidence interval testing of the data confirm that the effect exists in the following examples.
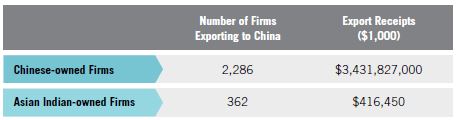
According to the 2007 SBO, Chinese-owned firms export more to China than Asian Indian owned firms. The number of Chinese-owned firms that export to China is significantly higher than the number of Asian Indian-owned firms that export to China, as shown in Table 9.
Table 9. Chinese MBE Exports to China vs. Asian Indian Exports to China, 2007
Source: U.S. Census Bureau, 2007 Survey of Business Owners; statistical analysis by author. *Note: RSEs are included in Appendix 1.
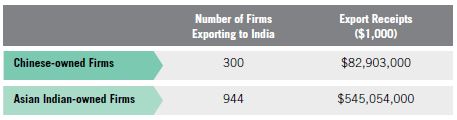
Based on the results of confidence interval testing, the number of Asian Indian-owned firms that export to India is significantly greater than the number of Chinese-owned firms that export to India, as shown in Table 10.
Table 10. Asian Indian MBE Exports to India vs. Chinese Exports to India, 2007
Source: U.S. Census Bureau, 2007 Survey of Business Owners; statistical analysis by author. *Note: RSEs are included in Appendix 1.
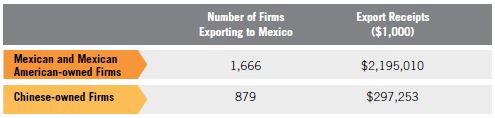
There is a significant difference between the numbers of Mexican-owned firms that export to Mexico compared to that of Chinese firms that export to Mexico. Mexican firms export at nearly double the amount, as shown in Table 11.
Table 11. Mexican and Mexican American MBE Exports to Mexico compared to Chinese Exports to Mexico, 2007
Source: U.S. Census Bureau, 2007 Survey of Business Owners; statistical analysis by author. *Note: RSEs are included in Appendix 1.
Hispanic-owned firms that export to Mexico do so at significantly higher rates than Asian-owned firms, as shown in Table 11.
Table 12. Hispanic MBE Exports to Mexico compared to Asian Exports to Mexico, 2007
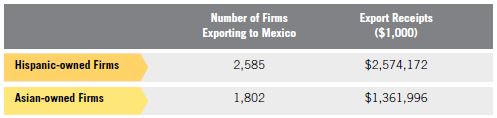
Source: U.S. Census Bureau, 2007 Survey of Business Owners; statistical analysis by author. *Note: RSEs are included in Appendix 1.
Collectively, the analyses of MBE exporting characteristics indicate that they do indeed have distinct and unique advantages when exporting to countries of their ethnic heritage. The data also suggest that their advantages might rest heavily upon knowledge of the importers’ language and culture, social and family ties, and an ability to act as mediator between domestic and international interests.
Available Resources for MBE Exporters
Having robust information about exporting opportunities is critical for minority-owned firms interested in developing emerging and existing business models. As discussed, some firms have their own resources, such as country of origin market connections, while others depend on information conveyed through government channels and institutional facilitators. Some of the main governmental and non- governmental resources that are available to help firms identify export opportunities are briefly described in this section.
Federal Government
At the federal level, agencies that are involved in trade promotion are members of the Trade Promotion Coordination Committee (TPCC).59 Among these agencies, the U.S. Department of Commerce and the Small Business Administration (SBA) have domestic outreach facilities where hands on advice and information is provided to steer clients to resources that help them identify specific market opportunities. The U.S. Department of Commerce also has an extensive network of overseas offices through its U.S. Commercial Service.60
U.S. Department of Commerce
Within the Commerce Department, three resources are particularly well positioned to provide export opportunity information, which include: U.S. Exporters Assistance Centers (USEACs), Export.Gov, and MBDA. The role of each are described below.
U.S. Export Assistance Centers (USEACs),61 operated by the International Trade Administration (ITA), have “boots on the ground” international trade specialists based in more than 100 USEACs in the United States and Puerto Rico. These specialists provide assistance to new exporting firms, and to firms that want to expand into additional export markets and increase their share in existing markets. USEACs also connect U.S. companies with additional trade resources and provide information about specific trade opportunities.
Export.Gov is an online resource that is dedicated solely to exporting. It is the primary resource through which Country Commercial Guides (CCG) are disseminated. CCGs are prepared annually by U.S. embassies with the assistance of several U.S. Government agencies, especially the U.S. Department of Commerce. CCGs present a comprehensive look at the commercial environments of countries using economic, political and market analysis. Importantly, each guide also identifies top prospects for U.S. products and services in each country. For more information, visit: http://export.gov/.
The Minority Business Development Agency (MBDA) has a nationwide network of business centers and resources to reach out and support MBE exporters. MBDA is also in a position within the U.S. Department of Commerce to steer minority firms to the resources of other TPCC agencies. MBDA regularly collaborates with its sister agency, the International Trade Administration (ITA), on export opportunities, and refers clients on a regular basis. For more information, visit: http://www.mbda.gov/.
Liaison Officers at Multilateral Development Banks (MDBs), an additional U.S. Department of Commerce agency, play an important role in helping firms identify export opportunities. The Department of Commerce’s Advocacy Center is also responsible for managing the agency representatives to the Multilateral Development Banks (MDBs).62 The purpose of having the Liaison Officers report to the Advocacy Center is to monitor the proportion of MDB tenders that are won by American firms, and to ensure that American firms are informed about procurement opportunities that arise in connection with the development projects financed by the MDBs.
The Small Business Administration (SBA)
The SBA has multiple channels through which hands-on assistance and export leads are provided to firms. These include SBA District Offices where counselors provide assistance and information, Women Business Centers, and Small Business Development Centers (SBDCs). SBDCs provide assistance through 63 host networks branching out with more than 900 service delivery points throughout the U.S., the District of Colombia, Guam, Puerto Rico, American Samoa and the U.S. Virgin Islands. They are a key resource for providing a broad range of export assistance including directing firms to market opportunity data that are generated through TPCC agencies. For more information, visit: https://www.sba.gov/.
Local and State Governments
Local and state governments are also involved in trade promotion and provide a broad range of exporting assistance including trade missions, export assistance, and trade leads. Enterprise Florida (EFI)63 is often cited as a best case practice of state-level export promotion agencies. It provides companies with data, offers a searchable export directory, and heavily markets the state’s exporters. EFI is a public-private partnership that operates in conjunction with a statewide network of economic development agencies, and operates 12 foreign trade offices and seven in-state offices. Leading trade missions is a particularly important role played by EFI and other state and local level export promotion agencies, as confirmed by case study participants in this report, as well.
Government-Supported Financial Agencies
The Export-Import Bank (“Ex-Im Bank”) of the United States assists with the financing of U.S. goods and services to international markets. The Ex-Im Bank issues fixed- rate financing to credit-worthy, international buyers in both the public and private sectors. It also provides loan guarantees for financiers of foreign buyers towards the purchases of U.S. capital equipment and services. Finally, the bank supports export credit insurance to cover the risks associated with buyer nonpayment and certain political risks (e.g., war or inconvertibility of currency).
The Overseas Private Investment Corporation (OPIC) also supports U.S. private sector investment in emerging markets by offering capital and risk mitigation tools. Companies can receive direct loans and guarantees up to $250 million with maturities up to 20 years on projects that meet the minimum U.S. ownership requirement. OPIC also allocates political risk insurance, specialty coverage for investments in the renewable resources sector, and provides additional support for private equity investment funds.
Non-Governmental Facilitators
Institutions that include the Chambers of Commerce, Business Roundtables, the National Minority Supplier Development Council and others, play a role in providing export opportunity information to their members. In some cases, these organizations develop their own market research; in others, they consolidate information from federal and other government sources to pass on to their members. Industry associations, which often undertake original research about global demand for the specific products of their members, are another key source of information.
Access to global markets is also pursued through the U.S. supply chain of Fortune 100 companies. In this program, MBEs can become global suppliers, facilitating their market entry strategy and reach into strategic developing economies.
Overall, these examples offer information for MBEs interested in exporting. Leveraging these resources can prove vital to MBEs entering or developing their export relationships. The four case studies presented in the next section of this report show how some MBEs draw on some of these resources to facilitate their ability to export.
Case Studies of Four Successful MBE Exporters and their Unique Characteristics
Case study respondents were selected on the basis of whether they exported to any of the five key NEI NEXT target markets of China, South Korea, Brazil, South Africa, and Colombia and on their willingness to participate. They were referred by export promotion agencies at the state level and by various TPCC agencies that are familiar with their work. This section represents a summary of notes from these interviews.
Case # 1: MBE Exporter Candace Chen: Exporting to China and to Multiple Countries
About the Owner
Candace Chen is a first generation Taiwanese American, and exporter to Taiwan, China, and other countries. She spent part of her childhood in Taiwan and later emigrated to the U.S. with her parents. Chen is the Founder, President and CEO of Power Clean 2000, a Los Angeles, CA firm founded in 2012. The company is a manufacturer of automotive service equipment and specialty chemicals. Chen recently established a new product, FaceLube for Men, which is a brand of eco-friendly men’s anti-aging skincare, grooming, and shaving products that are sold in domestic and international markets.
Chen is a small business advocate and well respected in the international trade community. She is often consulted by press and is a sought after speaker at high-level trade/ policy events. Among her many honors, she serves as an appointed trade policy advisor on SMEs to the U.S. Secretary of Commerce and the U.S. Trade Representative. Chen is a “Next Generation” member of the Pacific Council on International Policy that is the western affiliate of the Council on Foreign Relations, a non-partisan foreign policy membership organization and think tank based in New York. Previously, she chaired the U.S. SME Working Group of the Trans-Atlantic Business Dialogue, a high level US/ European Union Trade Policy Forum between American and European CEOs of Fortune 1000 companies, U.S. cabinet-level officials, and EU commissioners. Chen has also been formally recognized by the U.S. Department of Commerce with an award for achievement in trade.
Unique MBE Exporting Characteristics:
Entrepreneurial Orientation
“Being a child of entrepreneurs taught her both about business operations and about the culture of business,” Chen stated during the interview. Chen is entrepreneurially oriented, and in the category of those considered to be “born global.” Soon after establishing her company, she began preparing to export. While growing up in Taiwan she learned about exporting by observing her parents’ export business. They exported home décor from Taiwan and later exported from the U.S. after the family emigrated there. Chen’s parents made sure that she and her siblings had active roles in the family business, which helped plant the seeds of entrepreneurship in her and the desire to become an exporter one day.
Country of Origin Linkages
Chen always knew that she could draw on connections with family and friends in conducting business in Taiwan, as her family maintains strong ties in Taiwan and in a number of Chinese-speaking countries. During the interview, she noted that being a first generation Taiwanese American had obvious advantages for her in China and Taiwan. She is also fluent in Mandarin Chinese which allows her to cull through Chinese language news media for business information and for information to help her prepare for meetings with her in-country counterparts.
For Chen, country of origin was not guaranteed entry into a country’s export system. “There are limits to the advantages that country of origin linkages can confer,” Chen says. “Having connections doesn’t mean that it’s easy to do business in the countries in which one has a network,” she emphasized during the interview.
While Chen’s networks and linkages assisted her in doing business in her target markets to some extent, in the end, they could not help her circumvent the formidable institutional barriers she faced in exporting to Taiwan and China. The bureaucracy associated with obtaining government licenses and certifications was so great that she was not initially able to export to either country. As a result, her first exports were solely to Greece—though eventually she was able to break into her target markets.
Cultural Assets
In her interview, Chen noted that her Chinese heritage is both a bonus and common ground that helps her build trust in relationships more quickly, particularly those Asian countries such as Korea, Japan, Thailand, Singapore, Vietnam, and so on, where the culture is influenced by Confucian traditions. Chen takes the further step of adjusting her dialect depending on which country she is working, that also helps build trust.
“Trust,” she said, “while important in business, does not necessarily overshadow credentials or other factors.” Chen has learned that it is advisable to take time to build trust with local partners, especially before transferring any sensitive technology to them. “When business partners are relatives it’s easier to build trust of course,” she shared. Though she chose not to partner directly with relatives in Taiwan, her family has been helpful in referring business and in helping her to screen potential partners.
While trust conferred through ethnic ties is an important asset, according to Chen, compatibility between the senior management of the partnering firms outweighs it. “Each firm’s credentials, financial standing, service philosophy, and on-line reputation is critically important and should be weighed,” Chen underscored during the interview. In her experience, if the U.S. firm is marketing a new technology or product concept, choosing partners with the same passion is far more important than a larger partner with little enthusiasm.
“Power Clean 2000 supplies cutting-edge American technology that is in demand,” Chen shared. As a representative for her company, how clients perceive her also matters. In her interview, Chen noted that as a woman in a male-dominated industry, she stands out and is differentiated as a person of Chinese heritage who speaks “Americanized English.”
Leveraging U.S. Government Trade Promotion Resources
Chen attributes having made some of her market inroads overseas by utilizing U.S. Government resources. Soon after establishing Power Clean 2000, Chen attended an annual automotive trade show in Las Vegas. There, she was approached by a trade specialist from the U.S. Department of Commerce who wanted to introduce the Agency’s exporting programs for small firms. She was skeptical because she equated the federal government with the “Internal Revenue Service,” and could not fathom that a branch of government existed that was actually pro-small business. Nevertheless, Chen kept the government representative’s card, and subsequently made an appointment. She soon took advantage of the resources enumerated. Chen eventually utilized most of the export assistance programs that were offered at the time, including agent/distributor searches and trade missions.
Chen also sought out the assistance of the U.S. Embassy. Working with the staff, she began to understand that government export assistance programs could help her get into new markets, and lower the cost of doing so. Incrementally, with the help of government export assistance and her own networks, Chen has built her own export portfolio - one market after another in a relatively short amount of time. While she does business in Asia, she also exports to Bangladesh, the U.K., South Africa, and Brazil. The company’s current challenges are the firm’s technical capabilities—not her dreams and ambitions.
Chen has participated in the U.S. Department of Commerce’s “Gold Key” program64 and continued to work with the U.S. Embassy to connect her to the appropriate prospects within a country.
Impact of Exporting
At the time of the interview, direct exports of Power Clean 2000 account for an estimated 15-20 percent of its total revenues – they used to represent an even higher proportion. Over the years, however, the company’s business model changed to one that puts greater emphasis on exporting indirectly through licensing agreements and technology transfers. Her partners are now incorporating Power Clean 2000 technology and components into their exported products. The company’s new product line, FaceLube for Men, is intended for direct export and is already being exported on a trial basis to a handful of foreign markets.
Overcoming Trade Barriers
Unlike many other SMEs, financing hasn’t been a major problem for Power Clean 2000, but intellectual property right (IPR) protection has been. In this regard, China continues to be a particularly troublesome market. “Over the years, the company has encountered just about every conceivable IPR nightmare,” Chen stated, “including costly battles in local courts and corrupt local officials, to scenarios where judgment-proof competitors would simply open up shop as a new entity to sell the same counterfeited goods faster than the court could serve judgment papers.” Except for the ability to understand legal decisions and converse with lawyers without the need for translators, her Chinese heritage has been of no help in preventing IPR theft. Chen has learned the hard way that in China that distribution contracts are only as good as the people who sign them. In her opinion, the best protection against IPR theft is undertaking robust due diligence before entering into an agreement with any foreign partner. Continued vigilance is also needed, which Chen cautioned not to leave solely in the hands of distributors.
Case # 2: MBE Exporter Irismar Henrie: Exporting to Brazil and to Multiple Countries
About the Owner
IIrismar Henrie is a Brazilian American, born and raised in Rio, Brazil, and emigrating to the U.S. more than 20 years ago. Henrie has over 30 years of experience in the international market, working with a diverse range of small, large and multinational companies, importing and exporting a variety of manufactured products, and working with international banks. Henrie holds a Bachelor’s degree in the English, German, Spanish and Portuguese languages from the State University of Rio de Janeiro in Brazil. Her diplomas in the German language are from Goethe-Institut and Ludwig-Maximilans-University in Munich, Germany. In addition, Henrie was a scholarship holder of Funcex (Fundação Centro de Estudos do Comércio Exterior), a private institution whose main purpose is the development of Brazilian foreign trade, associated with Cacex-Carteira de Comércio Exterior do Banco do Brasil S.A,. Funcex is a permanent and independent channel of communication between the private and public sector, important for the development of foreign trade policies that benefit entrepreneurs.
In November 2001, Henrie established Iris Trade in New York, an import and export firm that trades mostly with Brazil, China, and Europe. The company also acts as reseller, trader, merchant, and agent and distributor for large global manufacturers of industrial products and raw materials. Recently, Iris Trade launched a new division, Iris Naturals International that specializes in supplying functional ingredients for the dietary supplement, cosmeceutical, nutraceutical, and pharmaceutical industries. New markets in Asia and Europe have been opening up for these products and for the wide range of botanicals “in natura” and organic raw materials that Henrie supplies from growers in the Amazonian Region of Brazil.
Unique MBE Exporting Characteristics:
Entrepreneurial Orientation
Henrie worked with her parents at their two wholesale stores in Rio de Janeiro, Brazilas as a teenager. In the role of apprentice, she learned basic business acumen, and paid particular attention to the importance of good customer service, salesmanship, and the need to price products competitively. Prior to starting her own firm, Henrie worked in the international trading field for several small and large international companies. During that time, she always had sights on opening her own business and worked extensively in Brazil, Germany, and in the United States.
Country of Origin Linkages
While Henrie doesn’t have family and friends in Brazil to constitute a business network, she had an impressive roster of customers that she has built up over the years. As a Brazilian, she is also part of the culture and understands how to be advantageous in her business dealings. Because Henrie worked in Brazil, including when working for others, she had a “ready-made” customer base and was prepared to transition to entrepreneurship. Henrie noted during the interview that, since she has been in business, there was never a time that she didn’t have customers.
Impact of Exporting
Over the years, Henrie has experienced challenges as a small business owner, particularly when collecting payments. She shared in the interview that the scale of her business is too small to take huge risks. She indicated that she has gotten “burned” in business twice, but not to a major extent. “In the normal course of business, not everything always works out,” she noted during the interview. Henrie also recognized that any risks she has taken have been worthwhile because her business continues to grow, along with her reputation in Brazil.
All of Iris Trade’s revenue – approximately $1 million annually – is generated from trading. Its trading portfolio includes its mainstay products of spare parts, accessories for textile machinery, aviation and mining equipment, and electronics that are sold mostly to Brazil. Iris Trade’s new product line of Iris Naturals is also becoming increasingly important and has opened up new markets in France, South Africa, Korea, Indonesia, Holland, and Canada.
Overcoming Barriers to Exporting
There is a distinction between the barriers Henrie has faced as a businessperson in the U.S., and those that are specifically related to exporting. In terms of the former, Henrie stated that she has experienced discrimination as a woman and ethnic minority in the U.S. that she believes is the reason why she had initial difficulties obtaining credit.
After nearly a year of trying, Henrie was finally able to secure a SBA-backed loan—but only after she refinanced her apartment and utilized a portion of the proceeds to grow her business. Aside from the SBA-backed loan, she was unaware at the time of the interview of other government resources that could assist her and hasn’t had the time to fully investigate the possibilities.
There are no major barriers that Henrie has experienced in Brazil, but she also noted that she primarily works with larger companies that have insulated her from some of the challenges experienced by MBEs. If Henrie wanted to elevate her business in size and scale, she shared, she would probably have to open a local office in Brazil; however, at the time of the interview, she was not ready to make that investment. When Henrie completed the interview, she was satisfied with working with larger companies, agents, and distributors in Brazil, and through facilitators in the other countries in which she works.
Case # 3: MBE Exporter Luis German Guacaneme: Exporting to Colombia
About the Owner
Luis German Guacaneme established Dinamica International, Inc., DBA Gator Turf, a multi-line flooring and surface coverings solutions company, in Boca Raton, Florida, in 1998. It is a family-run business that includes his wife, son, and daughter. Dinamica primarily exports to Colombia that is Guacaneme’s country of origin. Prior to establishing his business in the U.S., Guacaneme imported products from the U.S. into Colombia. At a certain point, he stated, ”[It} dawned on him that it might be more advantageous to do it the other way around; to export products to Colombia from the United States.”
Unique MBE Exporting Characteristics:
Country of Origins Linkages
“Being from Colombia and exporting to the country has a number of benefits,” according to Guacaneme. First and foremost, he noted that “having cultural and linguistic ties makes it easier to understand the business environment and to be accepted by customers; it also makes it easier to collect market information.” Guacaneme found that being familiar with and having ties in the Colombia market enabled him to access information about strategic partners, agents, and distributors more readily than might otherwise be the case. These ties also helped him to identify and create export opportunities through Spanish language advertising and product promotion within the country.
Family connections were also very valuable for Guacaneme. His network of family and friends in Colombia assisted him in identifying business leads that supplemented his own research. Guacaneme also added that having the inside track as a native of Colombia was a two-fold benefit on both the exporting and importing sides of the business. In addition to being an exporter of flooring products and related services to Colombia, Guacaneme imports specialty food items and is now expanding into providing consulting services related to flooring.
In his interview, Guacaneme stressed that he had no special business ties with Colombia, just family and friends. He noted that he had to build his customer bases one client at a time.
Impact of Exporting
Guacaneme emphasized that exporting takes a lot of expertise and business owners cannot just rely on family connections and friends or even on knowledge of the market. “What’s important,” according to Guacaneme, “is to understand and be an expert in what you are selling, to provide good service after the sale, and to be known for reliability. Above all, one must believe in oneself.”
Leveraging U.S. Government Trade Promotion Resources
Guacaneme emphasized in his interview that the current Dominican Republic-Central America FTA (CAFTA- DR FTA) makes exporting to Colombia more attractive. Consequently, he expects to grow his exports to Colombia even further in the coming years.
He was also exploring other markets in the region and expanded his business reach into Venezuela, Guatemala, and Panama. It took Guacaneme thirteen years to consider branching out beyond the market that he knew and understood. Beyond the issue of knowing a particular country’s market, he stated that he needed to develop a comfort level with all of the mechanics of exporting. Over the years, he now feels like he has mastered the process, and can take full advantage of this knowledge base.
Guacaneme’s company will soon export to the Dominican Republic (DR). In preparation, Guacaneme participated in an export trade mission led by Enterprise Florida. During this process, he received invaluable advice about market prospects and is growing the business in the DR. In hindsight, Guacaneme found trade missions, like the one organized by Enterprise Florida, as very valuable in developing his business model. Despite this engagement, Guacaneme was somewhat skeptical about federal government assistance at the time of the interview. In his view, the attention is more on larger firms, not the smaller ones. But in the case of Guacaneme, he shared in his interview that “he’s happy to be proven wrong on this.”
Case # 4: MBE Don Williams: Exporting among African American Firms
As shared earlier in the report, African American exporters do not often have strong country of origin linkages making it more difficult to engage family ties associated with exporting. While data is not readily available, the experience of African American exporters can demonstrate how these firms are building upon previous business knowledge, available external resources and, in some cases, historical ties to other global communities of color. The case of MBE exporter Don Williams reflects some of the same unique characteristics, while highlighting more salient differences with African American-owned businesses engaged in exports.
About the Owner
Don Williams, an African American, is Founder, President, and CEO, of Princeton Healthcare International (PHI), which was established in 1998 in Atlanta, Georgia. By the year 2000, PHI was already exporting. PHI is a multi- line intermediary exporter doing business in numerous countries. One of PHI’s main lines of business is medical technologies and equipment that is sourced from a broad range of manufactures and suppliers. PHI’s expertise in medical devices and information technologies, medical diagnostics, patient monitoring systems, performance improvement, drug discovery, and biopharmaceutical manufacturing technologies, helps a wide-range of hospitals, administrators, and clinicians to find new ways to predict, diagnose, and treat diseases. PHI’s broad range of products and services also enable healthcare providers to better diagnose and treat cancer, heart disease, neurological diseases, and other conditions, earlier.
PHI exports both goods and services. In regard to the latter, PHI provides management consulting services to hospitals, clinics, and laboratories—both domestically and internationally. The company also specializes in strategic planning, operational assessments, feasibility studies, financial planning, Certificates of Need (CON), new service development, capital improvement planning, financing and implementation. PHI also provides assistance in securing financing, strategic planning, and in conducting feasibility studies.
As CEO of PHI, Williams engineered the first sale of healthcare equipment to the West African nation of Cote d’Ivoire (Ivory Coast) that was underwritten by the Export- Import Bank of the United States. He has since completed numerous equipment, service and financing transactions in West and Southern Africa, and is now regarded as a leading authority in U.S. trade with sub-Saharan Africa. In 2002, PHI’s exporting achievements in Africa received a special award from the U.S. Department of Commerce. After a series of successful transactions in Latin America, PHI became one of the first MBEs to obtain expansion financing from OPIC, a U.S. government agency that traditionally helps finance major sales in developing countries by Fortune 100 corporations. Mr. Williams holds a Bachelor’s Degree from Boston University and a Masters in Management from Northeastern University. He is a graduate of Columbia University’s Graduate School of Business, Executive Marketing & Business Program, and is a former Adjunct Professor of Marketing, Business Policy, and Healthcare Management.
Williams has served as chairman of U.S. Department of Commerce’s Industry Trade Advisory Committee (ITAC 11) on Small and Minority Business, which is an integral link between industry and the U.S. Government. He also serves as Board Director and Chairman for the Small Business Exporters Association of the United States, and Board Director for National Small Business Association. Previously, Williams was selected by former President Jimmy Carter to be a Member of the Board of Councilors of the Carter Center in Atlanta, the human rights institute founded by the former President.
Unique MBE Characteristics
Entrepreneurial Orientation
Williams is not an accidental exporter. He established his business in order to export – and he was well prepared for exporting from the start. Prior to establishing PHI, Williams was a senior professional at Siemens, which has a major international healthcare business. In that position, he learned about working in international markets. In his interview, he stated that: “[h]e always embraced internationalism and viewed himself as a global citizen, even though many found it extraordinary to see an African American world-traveler.”
Williams’ international outlook was based entirely on his own making and imagination. He had no family or friends who helped spark his interest in travel or international business, nor did he have a network of family and friends to serve as reference points or mentors. According to Williams, “The key is to never fear exporting.” During the interview, Williams considered himself to be in a category of naturally inclined to export. A combination of his own entrepreneurial spirit, his professional training and knowledge of the healthcare sector, and the mentoring he received at Siemens, has enabled him to become adept in international markets.
Today, over 50 percent of PHI’s revenue is derived from exporting and, in the future, Williams intends to skew the ratio to at least 70:30.
Impact of Exporting
As Williams reflected on his experience as an exporter, he underscored that there are no shortcuts. “You have to roll up your sleeves and do the work and the starting place is to know and understand your sector,” he said. As an intermediary exporter and direct exporter of services, Williams focuses on understanding his competition, current product prices and latest technologies, and other factors that define the medical sector. His apparent hard work and persistence help him to stay abreast of developments on both the supply and demand sides of his business.
Williams added, “Many times when I speak to audiences about exporting, everybody wants to know the answer about how to export and whether there’s a magic formula. There isn’t. Exporting is hard work and, as I have said, there are no shortcuts.”
When discussing his internal management, Williams shared that “[i]n my headquarters office, everybody works on our export deals, because exporting is the core of our business. Overseas, we have strategic partners in every market in which we are working and every relationship is structured to fit the particular circumstance.” Williams stated he has learned the hard way about how to vet and evaluate partners. “It’s not only about trust. The critical issue we care about is whether the partner has the commitment to get out there and sell.”
“Trust is built incrementally, one deal at a time. You take small smart steps and go from there. In the meantime, it is important to have your partners sign Non-Disclosure Agreements. In fact, we just sued a partner in South Korea— and we won,” Williams stated during the interview.
Overall, exporting has contributed to a more viable business model for PHI. According to Williams, “[m]y message in a nutshell is that exporting is rewarding, but it’s hard. You shouldn’t do it unless you are ready to do it, know what you are doing, and have a financial solution thatenables you to do it. One way or the other, jumping in blindly is not an option.”
Overcoming Barriers to Exporting
When PHI started, it had minimal capital. Williams emphasized that African American firms, as a whole, tend to be undercapitalized and under-resourced. “As a result, it’sparticularly difficult for African American firms to go global, as they often have to use their own money and typically their pockets aren’t deep enough,” he stated.
Williams, like many other African American firms, had no major financial backers - and no deep financing of any kind at the onset of his business. However, what he did possess was an abundance of knowledge about the sector and the personal traits of commitment, drive, and work ethic. Williams also knew how to source the products he wanted to sell overseas, and had some knowledge about foreign demand—especially in underserved markets. In short, he shared, “I knew if I could deliver [the right products at the right price], I was in. I didn’t have to have relatives or friends in the foreign markets; I was selling what they were buying.”
Many African American-owned firms, and most exporters, according to Williams, also start out in Canada and Mexico, which are very well known and easy to navigate markets. Williams, however, purposely went in another direction. Knowing that he’d have difficulty competing in the healthcare sector in Canada and Mexico against much larger firms, he focused on underserved markets where PHI didn’t have as much competition.
His first export experience was in Cote d’Ivoire; next, Ghana, India, and then Brazil, and he’s still in expansion mode. At the time of the interview, PHI exports products and services to ten countries including South Africa, Colombia, Chile, and South Korea.
“It is not a coincidence that PHI’s expansion globally is in markets where the U.S. has Free Trade Agreements (FTAs),” Williams said during the interview. “Such agreements matter to small firms like ours because they lower the cost by eliminating tariffs, which can make all the difference to my ability to compete.” By contrast, he stated: “not having FTAs with Brazil and South Africa hurts us a lot.”
Leveraging U.S. Government Resources
Williams sought both federal and state level support in the expansion of his exporting business. At the time of the interview, PHI took advantage of everything that is offered, and received export financing from the Ex-Im Bank and uses its insurance products, as well. PHI had also been the recipient of OPIC resources. Generally, Williams stated, “we stay apprised of what the government is doing at the federal and state levels and are in close touch with the state level export promotion authorities in the State of Georgia where we are located.” In addition, Williams, as an Advisor to the Secretary of Commerce on Trade Policy Matters Affecting Small and Minority Business for many years, felt connected to the appropriate resources and networks. “This Committee keeps me apprised of various trade policy matters and gives me a voice to raise my concerns,” said Williams.
Though he took advantage of government programs to promote his exporting, Williams stressed that he was not relying on the government to do his homework for him. Generally speaking, he stated, “I have deeper experience in doing global business than those in the government who would advise me – but that doesn’t mean that the connections and the information facilitated by government agencies aren’t important. They add to what I’m doing and researching on my own.”
“At the end of the day we have to remember that 95 percent of the world’s consumers are out there, not here—even though many firms are content just to sell to the U.S. Government. The growth is out there though so I’d encourage firms to get their ducks in a row to begin exploring new markets, but do it the right way, do your homework, and know what you are selling to whom,” Williams shared in the interview.
Lessons Learned From the Case Studies
Many of the themes in the literature review reflect the testimony of the case study participants. From their experiences, for instance, country of origin linkages can have a positive impact on exporting potential, but it’s also possible to succeed just being entrepreneurially-oriented as in the case of Don Williams who held no significant cultural ties to his exporting countries. Moreover, barriers to exporting require planning, vetting and partnerships to be properly addressed and resolved. Although some barriers, as in the case of Chen’s IPR infringement, are more difficult to overcome. These exporters all learn from experience and keep their aspirations for growth front and center. Accessing government resources was equally meaningful for case study respondents, especially when delving into unknown or less friendly business situations. Most important in all of the case studies was the salient point that understanding U.S. markets was as important of one’s awareness of global operations.
The case studies reveal six best practices for MBE exporters to be successful.
Doing nothing is not an option. All of the exporters had to start somewhere and the starting point was the desire to branch out overseas to expand their market opportunities. However, it is noted that all of the exporters were previously exposed to export operations before they started the process themselves.
Going it alone in foreign markets is not an effective export strategy. All of the case study participants emphasize the importance of having a professional and reliable network of agents, distributors, and/or partners in foreign markets to promote sales and provide support.
Taking advantage of all available resources is a good strategy, including trade agreements. In order to take advantage of resources, one must know what resources are available; this requires research and the willingness to engage with government entities in order to ascertain how they can help. Most of the profiled firms also managed to be involved with entities at various levels of government in order to stay better informed about trade policy. These firms also use this information to pinpoint and strategize about which markets to target.
Knowing when to listen to others or to go with your gut instinct is important. While the firms here profiled asked for advice from others, their own experience and judgments were paramount when making decisions about if and when they should enter into foreign markets.
Smaller can be better when exporting to a niche market. All of the case study respondents shared that smaller firms face greater obstacles to exporting. However, when smaller firms leverage their advantages in foreign markets, it can help them succeed. The profiled firms have shown that they use any advantages they have, including: knowledge, connections, and/or external resources. In the truest sense of the word, they are entrepreneurs.
When country of origins ties do not exist, MBEs can rely upon historical ties to global communities of color to cultivate cultural affinities. Exporting creates a competitive advantage for all MBEs, regardless of home country. In the case of MBEs the ability to compensate by increasing their knowledge of the country and the business acumen, along with requesting support to cultivate the appropriate economic ties, works to the advantage of these firms.
Going Forward
The data presented in the report suggest that more MBEs need to be cultivated to be exporters of products and services, and when they do, it positively impacts their bottom line. Such a finding is incredibly important as the scale of exporting is likely to assist MBEs gain parity in the marketplace. As MBEs export, it will be their level of experience, development of products and services and resolve to historical and persistent challenges that will facilitate further inroads in global markets. In the ensuing years since the 2007 SBO data were recorded, this has undoubtedly already occurred. The question is how to effectively support minority-owned firms to ensure that trade policy and trade promotion initiatives are crafted to unleash their full exporting potential.
Efforts by the U.S. Census Bureau to generate a richer dataset focusing on the totality of MBE exporters is a start, and this data should be equivalent to the information available about SME exporters.
Clearly, the data suggest that MBEs should be made aware of the value of exporting to expand their business models and reach. More targeted outreach to minority-owned firms is needed, and existing data should be supplemented with additional studies to better understand the locations, products, and methods of exporting among subgroups within the exporting universe. The characteristics of the subgroups vary and so do their exporting strategies, top products and services, and overseas markets, as the data in this report suggest. Thus, promotion strategies aimed at Asians may need to differ from those aimed at Hispanics or African Americans.
The data show that FTAs create export opportunities. FTA benefits should be promoted to seasoned and new MBE exporters. Evidence from the case studies has indicated that successful MBEs are seizing some of these opportunities. Consideration should, therefore, be given to expanding outreach to subgroups within the MBE universe of firms to ensure that they are aware of the opportunities afforded through FTAs.
Moreover, government and non-government resources must be highlighted to gain the level of commercial diplomacy needed to create more internationally-driven, minority-owned firms. Leveraging the expertise of the U.S. Department of Commerce, and the associated agencies, like MBDA, can only affirm the Obama Administration’s commitment to a more robust export economy.
Going forward, the research demonstrates that greater attention towards supporting MBE exporters is essential to their growth, and analyzing data about their characteristics to tailor trade promotion initiatives can also facilitate expansion. As the U.S. population trends toward a majority population, MBE share of business ownership should parallel this growth, with exporting as one of many viable options available to MBEs. Leveraging the ability of minority-owned firms to export benefits the nation through job and wealth creation and ultimately contributes to U.S. global competitiveness in existing and emerging industries.
MBDA has played an integral role in supporting MBEs that desire global business expansion and partnership. As the preeminent agency within the U.S. Department of Commerce committed to minority business development and expansion, MBDA will continue to serve as both a convener and connector of these firms in the U.S. and overseas.
APPENDIX 1:
Research and Methods Technical Notes
Introduction
The study commissioned by the Minority Business Development Agency of MBE exporters draws heavily on the U.S. Census 2007 SBO. In order to be able to make valid comparisons between datasets, the Consultant has been requested to undertake confidence interval testing. Accordingly, tests were applied to selected data (employment, productivity, and receipts) pertaining to the main characteristics of MBEs that have been addressed in the SBO report. In addition, tests have been conducted to determine the significance of selected country of origin social network effects that certain subgroups of MBEs can leverage to help them export.
Methodology
A test for the difference between two sample means was employed to determine whether there is significant difference between the means of selected estimates for MBEs that export compared to those that do not export. The difference between the means of each category of exporting MBEs was also compared to each other on their export to selected countries in order to determine whether MBEs export more to their countries of origin due to the social network advantages they are perceived to have. The countries selected are: China, India, and Mexico.
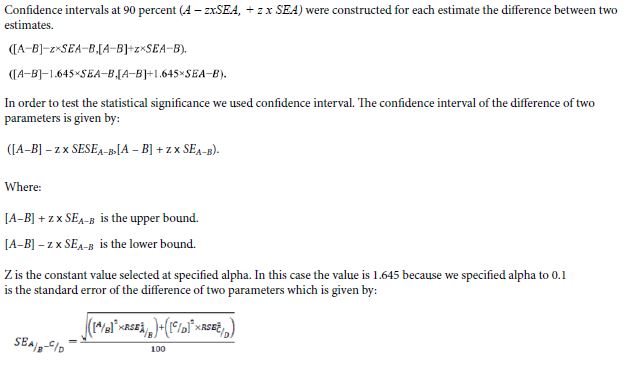
Analysis of Results and Report of Relative Standard Errors
Average Productivity
Table A. Relative Standard Errors for MBEs with Exports vs. MBEs without Exports for Table 6
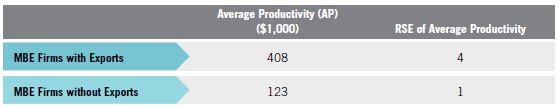
Source: U.S. Census, Survey of Business Owners, 2007
The average productivity for MBEs with exports was $408,000, while the comparable calculation for MBEs without exports was $123,000 showing a difference of $285,000 (90% CI: 311.9, 258.1)
Table B. Relative Standard Errors for MBEs with Exports vs. Nonminority Firms with Exports for Table 6
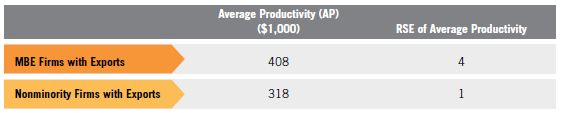
Source: U.S. Census, Survey of Business Owners, 2007
The average productivity of MBEs with exports was higher by $90,000 (90% CI: 117.4, 62.6) compared to the average productivity of nonminority firms with exports.
Table C. Relative Standard Errors for MBEs with Exports vs. Nonminority Firms without Exports for Table 6
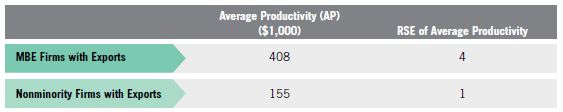
Source: U.S. Census, Survey of Business Owners, 2007
The average productivity of MBEs with exports was $408,000 compared to $155,000 for nonminority firms with exports, which shows a difference of $ 253,000 (90% CI: 312,000, 258,000).
Table D. Relative Standard Errors for Asian Firms with Exports vs.Asian Firms without Exports for Table 6
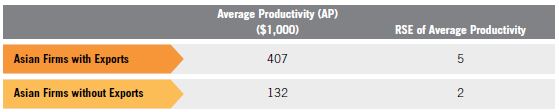
Source: U.S. Census, Survey of Business Owners, 2007
Average productivity of Asian firms with exports was $407,000, which was higher by $275,000 (90% CI: 308,800, 241,200) compared to $132,000 for Asian firms without exports.
Table E. Relative Standard Errors for Black or African American Firms with Exports vs. Black or African American Firms without Exports for Table 6
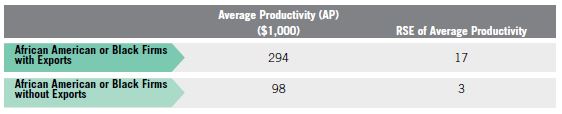
Source: U.S. Census, Survey of Business Owners, 2007
The average productivity of Black or African American firms with exports was $294,000, which was higher by $196,000 (90% CI: 278,400, 113,600) compared to $98,000 for Black or African American firms without exports.
Table G. Relative Standard Errors for Hispanic Firms with Exports vs. Hispanic Firms without Exports for Table 6
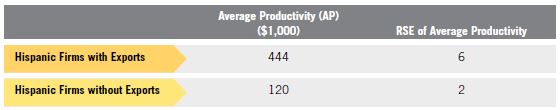
Source: U.S. Census, Survey of Business Owners, 2007
The average productivity of Hispanic firms with exports was $444,000, which was higher by $324,000 (90% CI: 368,000, 280,000) compared to $120,000 for Hispanic firms without exports.
Average Employment
MBEs with exports have higher average employment compared to minority and nonminority firms without exports. However, minority firms have lower average employment relative to nonminority firms with exports. The average number for MBEs with exports was 21, while the comparable number for MBEs without exports was 7, which shows MBE exporting firms have on average have 14 (90% CI: 15, 13) more employees than MBEs without exports.
Table H. Relative Standard Errors for MBE Firms with Exports vs. Nonminority Firms with Exports for Table 7
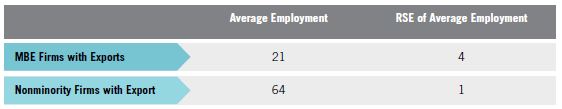
Source: U.S. Census, Survey of Business Owners, 2007
Average employment of MBEs with exports was 21 while while the comparable figure for nonminority firms was 64, which shows a difference of 43 employees (90% CI: -45, -41).
Table I. Relative Standard Errors Black or African American Firms with Exports vs. Black or African American Firms without Exports for Table 7
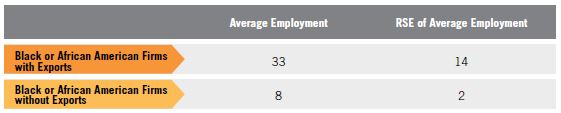
Source: U.S. Census, Survey of Business Owners, 2007
A comparison of average employment within the minority firms with and without exports show that the difference of the average employment among Black or African American firms with exports and those without exports was 25 (90% CI:33, 17). The wide confidence interval also shows greater variability of the average number of employment among Black or African-American firms.
Table J. Relative Standard Errors for American Indian and Alaska Native Firms with Exports vs.American- Indian and Alaska Native Firms without Exports for Table 7
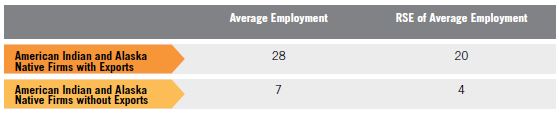
Source: U.S. Census, Survey of Business Owners, 2007
Comparison of average employment within the minority firms with and without exports show that the difference of the average employment among American Indian and Alaska Native firms with exports and those without exports was 21 (90% CI:30, 12). The wide confidence interval also shows greater variability of the average number of employment among American Indian and Alaska Native firms.
Table K. Relative Standard Errors for Asian Firms with Exports vs. Asian Firms without Exports for Table 7
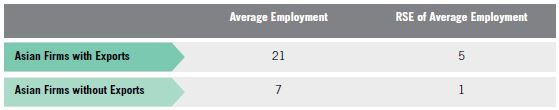
Source: U.S. Census, Survey of Business Owners, 2007
A comparison of average employment within the MBES with and without exports shows that the average employment among Asian firms with exports was higher by 14 (90% CI: 16, 12) relative to those without exports.
Table L. Relative Standard Errors for Hispanic Firms with Exports vs. Hispanic Firms without Exports for Table 7
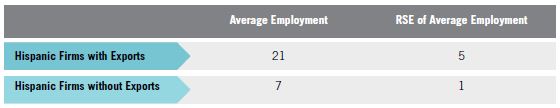
Source: U.S. Census, Survey of Business Owners, 2007
Comparison of average employment among Hispanic firms with and without exports show that the average employment among Hispanic firms with exports was higher by 12 (90% CI: 13, 11) relative to those without exports.
Exports Receipts as a Share of Total Revenue
The share of receipts that are derived from exports indicates the extent of a firm’s export orientation. The higher the share the greater the degree of export orientation. Significance tests were conducted to ascertain the difference in the export orientation of MBEs compared to nonminority firms.
Table M. Relative Standard Errors for Export Share of Total Revenue: MBE Firms with Exports vs. Nonminority Firms with Exports for Table 8
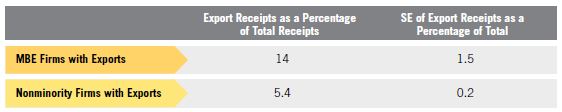
Source: U.S. Census, Survey of Business Owners, 2007
The share of export receipts of total revenue for MBEs with exports was 14% compared to the 5.4% for nonminority firms with exports showing a difference of 8.6% (90% CI 8.9, 8.3).
Table N. Relative Standard Errors for Comparison of Export Share of Total Revenue Among MBE Firms with Exports: Hispanic vs. Asian Firms for Table 8
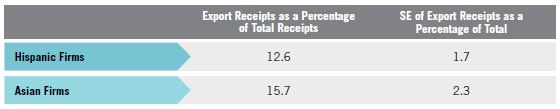
Source: U.S. Census, Survey of Business Owners, 2007
Comparison of export receipts as a share of total revenue between Hispanic and Asian firms shows that the difference is not statistically significant (90% CI 6.7, -0.5) since the confidence interval contains zero.
Table O. Relative Standard Errors for Comparison of Export Share of Total Revenue Among MBE Firms: Black or African American vs. Hispanic Firms for Table 8
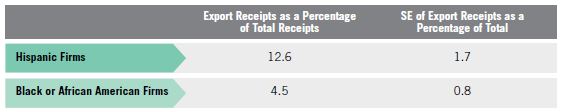
Source: U.S. Census, Survey of Business Owners, 2007
A comparison of export receipts as a share of total revenue between Hispanic firms and Black or African American firms show that the share for Hispanic firms is greater by 8.1 percentage points (90% CI 11.6, 4.6). However, the wide confidence interval shows wide variability of the estimate.
Table P. Relative Standard Errors for Comparison of Exports Share of Total Revenue Among MBE Firms: Black or African American vs. Asian Firms for Table 8
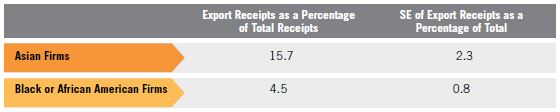
Source: U.S. Census, Survey of Business Owners, 2007
A comparison of export as a share of total revenue between Asian firms and Black or African American firms shows that the share for Asian firms is greater by 11.2 percentage points (90% CI 11.8, 10.6).
Export Market Destination: Country of Origin Social Network and Export Performance
Table Q. Relative Standard Error for Comparison of Chinese MBE Firms Exporting to China vs.Asian Indian Firms Exports to China for Table 9
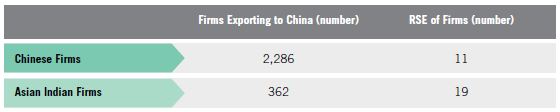
Source: U.S. Census, Survey of Business Owners, 2007
While the difference between the number of Chinese MBEs exporting to China and Asian Indian firms exporting to China is significant, [90% CI 2353, 1495], the very wide confidence interval observed can be attributed to the wide variability of the population of Asian Indian firms from which the sample is taken which is reflected in its high relative standard error. Thus the confidence interval, while statistically significant, does not provide much information about the difference in exporting between Chinese and Asian Indian firms to the China market.
Table R. Relative Standard Errors for Asian Indian MBE Firm Exports to India vs. Chinese Firm Exports to India for Table 10
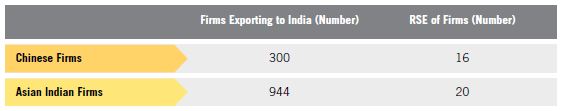
Source: U.S. Census, Survey of Business Owners, 2007
The difference between the number of Asian Indian–owned firms and the number of Chinese firms that export to India ranges from 324 to 964 [90% CI 964, 324].
Table S. Relative Standard Errors for Hispanic MBE Firm Exports to Mexico vs. Asian MBE Firms Exports to Mexico for Table 11
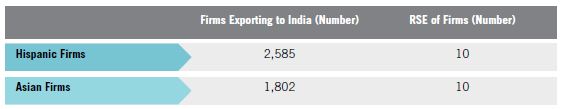
Source: U.S. Census, Survey of Business Owners, 2007
The difference between the number of Hispanic firms exporting to Mexico compared to Asian firms exporting to Mexico ranges from 265 to 1,301(90% CI 1301, 265) showing that more Hispanic firms export more to Mexico than Asian firms.
Table T. Relative Standard Errors for Mexican, Mexican American, Chicano MBE Firm Exports to Mexico vs. Chinese MBE Firm Exports to Mexico for Table 12
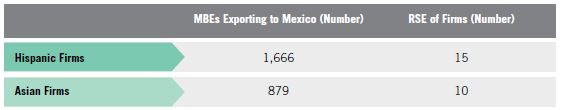
Source: U.S. Census, Survey of Business Owners, 2007
The difference between the number of Mexican, Mexican American, Chicano–owned firms and the number of those of Chinese firms that export to Mexico ranges from 351 to 1,223 firms [90% CI 1,223, 351].
References
Behncke, Nadine. 2014. The Structure of Ethnic Networks and Exports: Evidence from Germany. Discussion Paper No. 198. Center for European and Economic Development Research. Germany: University of Goettingen.
Department of Commerce, International Trade Administration. 2015. “Free Trade Agreements.” Trade.Gov. January 1.
Enterprise Florida. 2015. “Enterprise Florida, Economic Development Organization for the State of Florida.” Enterprise Florida.
Fairlie, Robert, and Alicia Robb. 2010. Disparities in Capital Access between Minority and Nonminority-Owned Businesses: The Troubling Reality of Capital Limitations Faced by MBEs. Washington, DC: U.S. Department of Commerce, Minority Business Development Agency.
Fairlie, Robert. 2008. Estimating the Contribution of Immigrant Business Owners to the U.S. Economy. Under contract no. SBAHQ-07-M-0380. Washington, DC: U.S. Small Business Administration.
Fairlie, Robert. 2012. Immigrant Entrepreneurs and Small Business Owners, and Their Access to Financial Capital. Under contract no. SBAHQ -10-R-0009. Washington, DC: Small Business Administration (SBA).
Fiscal Policy Institute. 2012. Immigrant Small Business Owners: A Significant and Growing Part of the Economy. New York, NY: Fiscal Policy Institute.
Grieco, Elizabeth, Edward Trevelyan, Lars Larsen, Yesenia Acosta, Christine Gambino, Patricia de la Cruz, and Nathan Walters. 2012. The Size, Place of Birth, and Geographic Distribution of the Foreign-Born Population in the United States: 1960 to 2010. Working Paper No 96. Population Division. Washington, DC: U.S. Census Bureau.
International Trade Administration. 2015. “Doing Business in Africa.” Trade.Gov. September 28.
Johnson, Martin, and Chris Rasmussen. 2013. Jobs Supported by Export S 2012: An Update. Washington, DC: Department of Commerce.
Morales, Gabriela. 2014. “Look South: Increasing U.S. Trade with Latin America.” MBDA.Gov. January 13.
Naldi, Lucia, and Mattias Nordqvist. 2008. Family Firms Venturing into International Markets: A Resource Dependence Perspective. Washington, DC: U.S. Small Business Administration.
Office of the United States Trade Representative. November 2011. “The United States in the Trans-Pacific Partnership.” USTR. Gov.
Office of the United States Trade Representative. March 15. “Free Trade Agreements.” USTR.Gov.
Office of the United States Trade Representative. March 15. “Transatlantic Trade and Investment Partnership (T-TIP).” USTR. Gov.
Patel, Pankaj, and Rodney D’Souza. 2009. Leveraging Entrepreneurial Orientation to Enhance SME Export Performance. Under contract number SBAHQ-08-M-0320. An Office of Advocacy Working Paper. Washington, DC: U.S. Small Business Administration (SBA).
Peek, Joe. 2013. The Impact of Credit Availability on Small Business Exporters. Under contract number SBAHQ-11-M-0206. Washington, DC: U.S. Small Business Administration.
South Africa.Info. April 19, 2013. “Black Economic Empowerment.” SouthAfrica.Info.
The Presidents Export Council. March 11, 2011. “PEC SME Trade Capacity Export Assistance Letter.”
The Small Business Exporters Association of the United States. 2014. Trans-Pacific Partnership (TPP). Issue Brief. National Small Business Association (NSBA).
The White House. March 11, 2010. “Executive Order 13534 - National Export Initiative.” Whitehouse.Gov.
U.S. Census Bureau. 2012. “National Population Projections: Summary Tables ‘Middle Series’ Tables 4 – 9, Projections of the Population by Sex, Race, and Hispanic Origin for the United States: 2015-2060.” U.S. Census Bureau.
U.S. Census Bureau. December 12, 2012. “U.S. Census Bureau Projections Show a Slower Growing, Older, More Diverse Nation a Half Century from Now.” Census.Gov.
U.S. Census Bureau. 2013. “Current Estimates Data, National and State Population and Demographic Components of Population Change.”
U.S. Census Bureau. 2015. “American Community Survey and the 2010 Census – About the Survey.” Census.Gov.
U.S. Census Bureau. 2015. “American Community Survey and the 2010 Census – About the Survey, A Joint Effort Between the Bureau of Labor Statistics and the Census Bureau.” Census.Gov.
U.S. Census Bureau. 2015. “American FactFinder.” Factfinder.Census.Gov.
U.S. Census Bureau. 2015. “Data & Documentation, American Community Survey, Instructions for Applying Statistical Testing.” Census.Gov.
U.S. Census Bureau. 2015. “Population, About: Race.” Census.Gov.
U.S. Census Bureau. 2015. “Statistics for All U.S. Firms by Industry, Gender, Ethnicity, and Race for the U.S., States, Metro Areas, Counties, and Places: 2007, Survey of Business Owners.”
U.S. Census Bureau. 2015. “US Census Bureau, State and County Quickfacts.” Quickfacts.Census.Gov “Export Contact Specialists, Export Assistant Centers.” Export.Gov.
U.S. Commercial Service. 2015. “Multilateral Development Banks.” Export.Gov.
U.S. Department of Commerce, International Trade Administration. 2015. “Free Trade Agreements.” Trade.Gov.
U.S. Department of Commerce, International Trade Administration. 2015. “Fact Sheet: National Export Initiative/NEXT.” Trade. Gov.
U.S. Department of Commerce, International Trade Administration. 2013. “U.S. Export Fact Sheet: December 2012 Export Statistics Released February 8, 201.” Department of Commerce.
U.S. Department of Commerce, International Trade Administration. 2015. “U.S. Commercial Service in Your State.” Trade.Gov.
U.S. Department of Commerce, Minority Business Development Agency. 2012. “Doing Business in Africa Campaign Fact Sheet.” MBDA Web Portal. MBDA.Gov. November 28.
U.S. Department of Commerce, The International Trade Administration, Economics and Statistics Administration. 2014. The Role of Exports in the U.S. Economy. Washington, DC: Department of Commerce.
U.S. Department of Commerce, U.S. Census Bureau. 2012. Ownership Characteristics of Classifiable U.S. Exporting Firms: 2007 - Survey of Business Owners Special Report. Washington, DC: U.S. Department of Commerce, U.S. Census Bureau.
U.S. Department of Commerce, U.S. Census Bureau. 2013. A Profile of U.S. Importing and Exporting Companies, 2010–2011. Washington, DC: U.S. Department of Commerce.
U.S. Department of Commerce. “Fact Sheet: National Export.” Commerce.Gov. Accessed March 18, 2015.
U.S. Department of Labor, Bureau of Labor Statistics. 2015. “Bureau of Labor Statistics Data, Unemployment Rate, Labor Force Statistics from the Current Population Survey: Year 2011.”
U.S. Department of State, Office of the Spokesperson. 2013. “Colombia and United States To Hold First Meeting on Racial and Ethnic Equality Action Plan.” State.Gov. June 10.
U.S. International Trade Commission. 2010. Small and Medium-Sized Enterprises: Characteristics and Performance. Investigation No(s). 332-508, 509, and 510. Washington, DC: U.S. International Trade Commission.
About the Minority Business Development Agency (MBDA)
The U.S. Department of Commerce’s Minority Business Development Agency (MBDA) is the only federal agency solely dedicated to the growth and global competitiveness of minority-owned businesses in America. Established in 1969, MBDA provides services to African American, Asian American, Hasidic Jew, Hispanic American, Native American/Alaskan, Native Hawaiian, and Pacific Islander entrepreneurs.
MBDA’s mission is to promote the growth and expansion of minority-owned businesses through the mobilization and advancement of public and private sector programs, policy, and research. The agency coordinates and leverages a
nationwide network of more than 40 MBDA Business Centers and a wide range of domestic and international strategic partners in support of its mission.
Over the past several years, MBDA has focused on providing business development services to minority entrepreneurs who are pursuing federal contracts, emerging industries, alternative sources of capital, and expansion to global markets. These services, and other agency programs and initiatives, continue to position minority entrepreneurs to build size, scale and capacity, create jobs, and strengthen the U.S. economy.
About the U.S. Department of Commerce
The U.S. Department of Commerce promotes job creation, economic growth, sustainable development, and improved standards of living for all Americans by working in partnership with businesses, universities, communities, and our Nation’s workers. The department touches the daily lives of the American people in many ways, with a wide range of responsibilities in the areas of trade, economic development, technology, entrepreneurship and business development, environmental stewardship, and statistical research and analysis.
Footnotes:
2 Note that 2007 is the latest year for which U.S. Census data are available and are constructed as the base year for the Census data used in this report. See also U.S. Department of Commerce, U.S. Census Bureau, “Ownership Characteristics of Classifiable U.S. Exporting Firms: 2007.”
3 See Executive Order 13534 on National Export Initiative (NEI): “...an initiative to improve conditions that directly affect the private sector’s ability to export...” (March 11, 2010).
4 This report, like the U.S. Census Bureau, defines nonminority as single race, non-Hispanic White. See “About: Race”. See also “U.S. Census Bureau Projections Show a Slower Growing, Older, More Diverse Nation a Half Century from Now”.
5 Based on Middle Series projections, Tables 4 – 9 Projections of the Population by Sex, Race, and Hispanic Origin for the United States: 2015-2060. See also “2012 National Population Projections: Summary Tables”.
6 See U.S. Department of Commerce, U.S. Census Bureau, “Ownership Characteristics of Classifiable U.S. Exporting Firms: 2007-Survey of Business Owners Special Report.”
7 Note that 2007 is the latest year for which U.S. Census data are available and are constructed as the base year for the Census data used in this report. See also U.S. Department of Commerce, U.S. Census Bureau, “Ownership Characteristics of Classifiable U.S. Exporting Firms: 2007-Survey of Business Owners Special Report.”
8 Refer to Executive Order 13534 on the National Export Initiative (NEI): “...an initiative to improve conditions that directly affect the private sector’s ability to export...” (March 11, 2010). The National Export Initiative (NEI NEXT) is a customer service-driven strategy with improved information resources that will ensure American businesses are fully able to capitalize on expanded opportunities to sell their goods and services abroad. See “Fact Sheet: National Export Initiative/NEXT” .
9 In survey sampling, different samples can be randomly selected from the same population; and each sample can often produce a different confidence interval. Some confidence intervals include the true population parameter; others do not. A confidence level refers to the percentage of all possible samples that can be expected to include the true population parameter.
10 The U.S. Census Bureau’s 2007 SBO data for MBE exporters focuses on key characteristics of the exporters, but not on information about their export behavior. For example, the report, A Profile of U.S. Importing and Exporting Companies, 2010–2011, provides data on how exporters export through foreign affiliates or as intermediaries, and data on the products and services exported to countries, similar data are not available for MBE exporters. It’s underscored that the main characteristics of MBE exporters examined by the 2007 SBO report pertain to three characteristics: employment size, receipts, and productivity. Likewise, the analyses presented in this report focus on these same three characteristics.
11 Confidence interval tests were performed on some of the 2007 SBO data pertaining to the main characteristics of MBE exporters and non-exporters. The results of these tests presented throughout the report are confirmed at the 90% confidence interval, which means if new estimates were made using exactly the same procedures, the confidence intervals would contain the average of the estimates 90% of the time. The full results of the tests are presented in the technical notes in Appendix 1.
12 While data are available on the products and services MBE exported and separate data are available on the countries to which MBEs exported, these data are not connected. It’s not possible therefore to determine which products and services were exported to which countries.
13 Refer to the following trade fact sheet, U.S. Department of Commerce, International Trade Administration, “U.S. Export Fact Sheet: December 2012 Export Statistics,” released February 8, 2013.
14 See Johnson, Martin and Chris Rasmussen, U.S. Department of Commerce, International Trade Administration, Jobs Supported by Exports 2012: An Update.
15 Identified exporters are those that can be linked to specific shipments. For the purpose of this study, not all exporters are linked and their numbers may be understated.
16 International Trade Administration, “National Export Initiative Fact Sheet”.
17 U.S. Department of Commerce, “Fact Sheet: National Export Initiative” (May 24, 2013).
19 See Trade.gov, “Doing Business in Africa,” (September 28, 2015).
20 Office of the U.S. Trade Representative (USTR), “Free Trade Agreements.”
21 See The International Trade Administration, Economics and Statistics Administration, The Role of Exports in the U.S. Economy, (May 13, 2014).
23 See Trade.Gov, “Free Trade Agreements,” (January 1, 2015). Such FTAs have played a significant role in helping to meet NEI NEXT goals of increasing exports. Collectively, exports to the 20 FTA countries represented nearly half of all U.S. goods exported in 2012. Collectively, exports to the 20 FTA countries represented nearly half of all U.S. goods exported in 2012.
24 Minority Business Development Agency, “Doing Business in Africa Campaign Fact Sheet,” (November 28, 2012).
25 Minority Business Development Agency, “Look South: Increasing U.S. Trade with Latin America,” (January 13, 2014).
26 Office of the U.S. Trade Representative, “The United States in the Trans-Pacific Partnership,” (November 2011).
27 As a group, TPP countries are the largest goods and services export market of the U.S. U.S. goods exports to the broader Asia-Pacific totaled $942 billion in 2012, representing 61 percent of total U.S. goods exports. U.S. private services exports totaled $226 billion in 2011 (latest data available), representing 38 percent of total U.S. private services exports to the world.
28 The Small Business Exporters Association of the United States, Trans-Pacific Partnership (TPP), (October, 2014).
29 Office of the U.S. Trade Representative, “The Transatlantic Trade and Investment Partnership.”
30 For statistical reporting purposes, the foreign born is a larger set than immigrants. They make up one in eight of U.S. residents. See also U.S. Census Bureau, “The Size, Place of Birth, and Geographic Distribution of the Foreign- Born Population in the United States: 1960 to 2010,” (October 2012).
31 Pankaj Patel, and Rodney D’Souza, 2009. “Leveraging Entrepreneurial Orientation to enhance SME Export Performance.” Under Contract number SBA HQ-08-M-320. An Office of Advocacy Working Paper. Washington, DC: U.S. Small Business Administration (SBA).
32 See U.S. Census Bureau, “American Community Survey: 2010.” See also Fiscal Policy Institute, “Immigrant Small Business Owners June 2012.”
33 Bureau of Labor Statistics and the U.S. Census Bureau, “Current Population Survey.” See also “Immigrant Entrepreneurs and Small Business Owners, and their Access to Financial Capital,” (May, 2012).
34 Fairlie, Robert, and Alicia Robb. 2010. Disparities in Capital Access between Minority and Nonminority-Owned Businesses: The Troubling Reality of Capital Limitations Faced by MBEs. Washington, DC: U.S. Department of Commerce, Minority Business Development Agency.
36 Fiscal Policy Institute, “Immigrant Small Business Owners June 2012.”
37 The U.S. Census does not disaggregate the two categories.
38 The source of the data for the Fiscal Policy Institute’s report is the 2010 ACS.
39 Behncke, Nadine. 2014. The Structure of Ethnic Networks and Exports: Evidence from Germany. Discussion Paper No. 198. Center for European and Economic Development Research. Germany: University of Goettingen.
42 This hypothesis has not been explored in existing literature. Success of these populations can be in part due to effective business acumen that compares with other similar-sized SMEs.
43 Black economic empowerment is not affirmative action, although employment equity forms part of it. It is essentially a growth strategy, targeting the South African economy’s weakest point: inequality. See also “Black Economic Empowerment”.
44 See press release “Colombia and United States to Hold First Meeting on Racial and Ethnic Equality Action Plan,” (June 10, 2013).
45 It is also noted that former MBDA National Director David Hinson traveled to Brazil to develop a framework for collaboration between the Department of Commerce and the Government of Brazil that is specifically designed to lead to greater market access for MBDA clients and export-ready firms.
46 Bureau of Labor Statistics and the U.S. Census Bureau, Current Population Survey, “State and County QuickFacts.”
47 See International Trade Administration. Letter from The Presidents Export Council: “Analysis suggests that, due to its “fixed-cost” nature, the cost burden of regulations can be disproportionately greater on SMEs vis-a-vis the financial impact on larger firms, as smaller firms tend to have less capacity to navigate through the complexities of regulatory and bureaucratic networks.” (March 11, 2011).
48 See Patel, Pankaj, and Rodney D’Souza. 2009.
49 Peek, Joe. 2013. The Impact of Credit Availability on Small Business Exporters. Under contract number SBAHQ-11-M-0206. Washington, DC: U.S. Small Business Administration.
51 The Export-Import Bank (“Ex-Im Bank”) of the United States is the official export credit agency of the U.S. whose mission is to ensure that domestic companies have access to the financing. The Ex-Im Bank does not compete with private financing.
53 U.S. International Trade Commission. 2010. Small and Medium-Sized Enterprises: Characteristics and Performance. Investigation No(s). 332-508, 509, and 510. Washington, DC: U.S. International Trade Commission.
55 Naldi, Lucia, and Mattias Nordqvist. 2008. Family Firms Venturing into International Markets: A Resource Dependence Perspective. Washington, DC: U.S. Small Business Administration.
56 Statistics from sample surveys are subject to sampling and non-sampling error. All comparisons made in the reports have been tested and found to be statistically significant at the 90 percent confidence level, unless otherwise noted. Please consult the appendix for specific margins of error. For more information, see U.S. Census Bureau American Community Survey reference documentation on Instructions for Applying Statistical Testing.
57 U.S. Census Bureau, Special Tabulation of 2007 SBA data for MBDA, January 2014.
58 This assumption is based on the results of confidence interval testing.
59 The TPCC is an interagency committee chaired by the Secretary of Commerce. It was established under the Export Enhancement Act of 1992 to provide a unifying framework to coordinate the export promotion and export financing activities of the U.S. government and to develop a government-wide strategic plan for carrying out such programs.
60 See Trade.gov, for a list of Commercial Service offices “U.S. Commercial Service in Your State.”
61 See Export.Gov, “Export Assistant Centers,” (April 3, 2009).
62 See Export.Gov, “Multilateral Development Banks,” (October, 7, 2014).
63 See also the following company website for Enterprise Florida.
64 The Gold Key program is a cost-recovery fee based, customized matchmaking service that enables U.S. companies to find an ideal overseas distributor or business representative. The program is provided through the U.S. Export Assistance Centers.